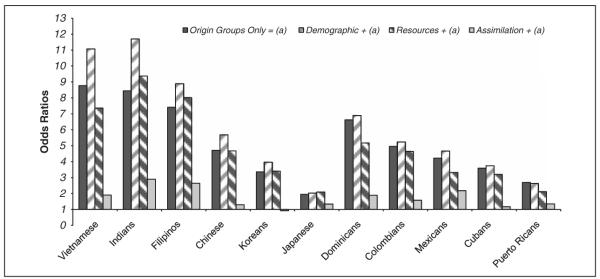
Figure 2.
Changes in the odds of extended living of Asian and Hispanic elders relative to those of native Whites after controlling for covariate subsets. Note: For each origin group, the first bar shows the zero-order odds ratio, the second bar shows the change in each group’s zero-order odds ratio after controlling for demographics, the third bar shows the change in each group’s zero-order odds ratio after controlling for resources, and the fourth bar shows the change in each group’s zero-order odds ratio after controlling for assimilation.

