
Figure 1. Flow chart of FSEC-TS.
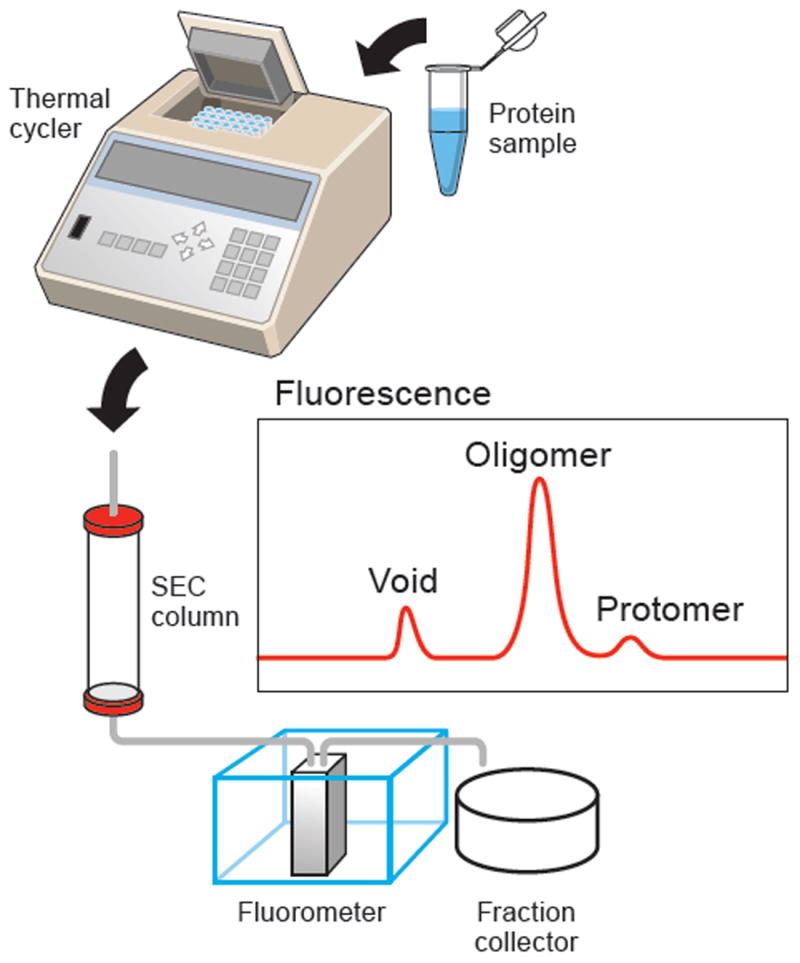
The protein sample, after heat treatment and centrifugation, is loaded onto a SEC column, connected to a fluorescence detector to monitor GFP or tryptophan fluorescence. The panel labeled “Fluorescence” shows a hypothetical elution profile from GFP or tryptophan fluorescence.