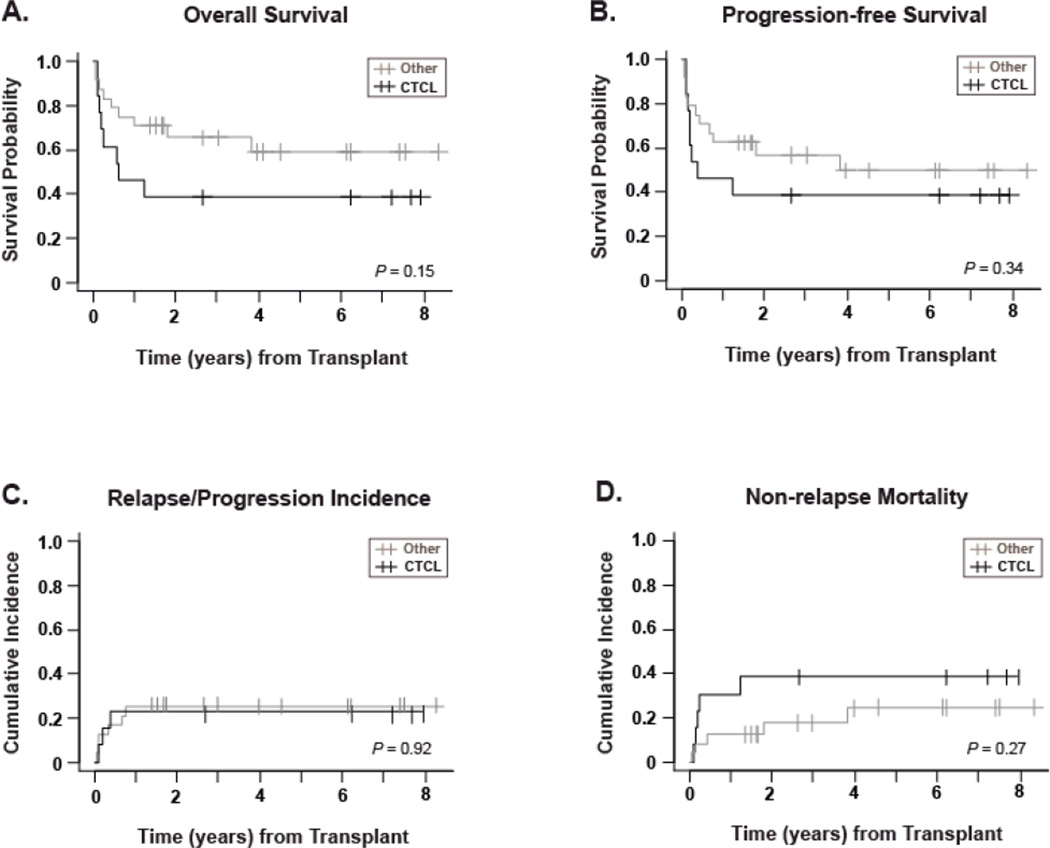
Figure 2. Outcomes stratified by histological subgroup.
All curves are stratified for histology: CTCL (n=13, black lines) versus Other PTCL (n=24, gray lines), with a median follow-up of 86 months for the CTCL surviving patients and 49 months for the Other PTCL group. P-values for log-rank comparison of curves are given in the bottom right hand corner of each graph. Panel A shows the Kaplan-Meier estimate of survival probability. Panel B shows progression-free survival, defined as time from stem cell infusion to recurrence, progression, or death from any cause, whichever occurred first. Panel C shows cumulative incidence of relapse/progression, defined as time from stem cell infusion to recurrence or progression. Panel D shows non-relapse mortality, measured as time from stem cell infusion to death from any cause other than disease relapse or disease progression. For data in panels C and D, relapse/progression and non-relapse mortality were treated as competing risks.

