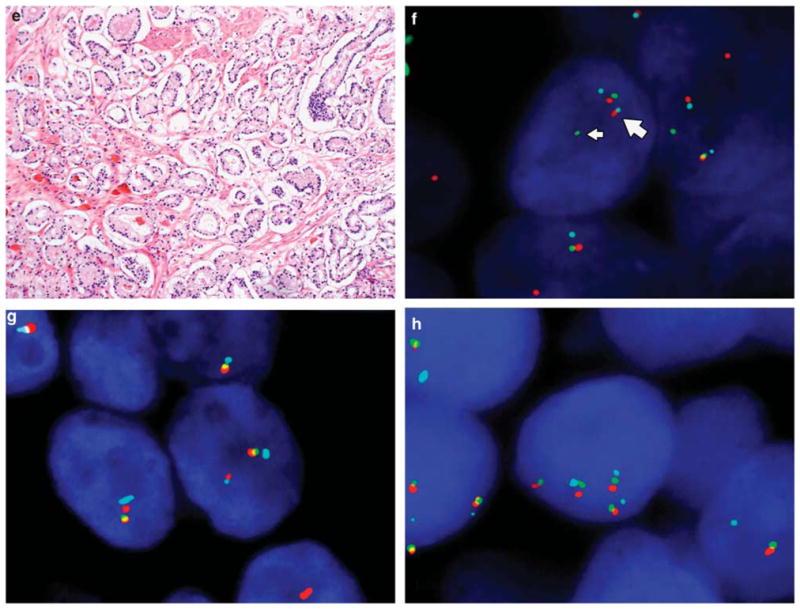
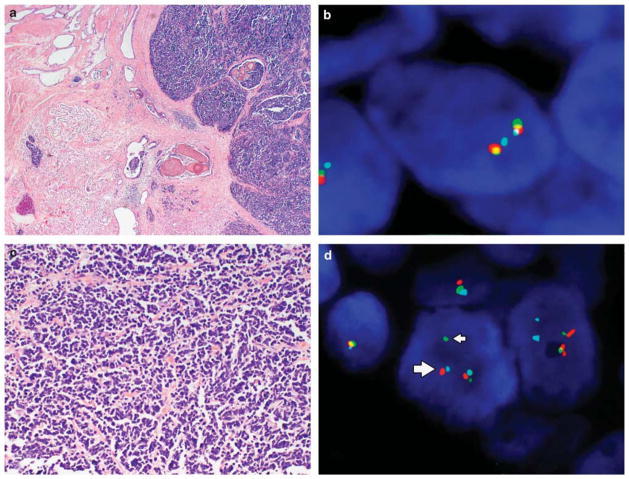
Figure 2.

Morphology and ERG gene rearrangement by FISH in small cell carcinoma and adenocarcinoma of the prostate. (a) Low magnification shows admixed small cell carcinoma and concurrent prostatic acinar adenocarcinoma. (b) The wild-type (normal) pattern of ERG demonstrates proximate or fused ERG 3′ (red) and ERG 5′ (green) signals with TMPRSS2 (aqua) either adjacent to or slightly separated from the red–green signal pair. (c) The small cell carcinoma cells are arranged in cords, nests, or sheets, with the nucleus showing prominent hyperchromasia, nuclear molding, small punctate nucleoli, and brisk mitotic activity. (e) In contrast, the typical prostatic adenocarcinoma component retains the characteristic small, round glands. ERG gene rearrangements were detectable by FISH in both small cell (d) and adenocarcinoma components (f). In the typical rearrangement, the green signal (ERG 5′, thin arrows) is separated from the red signal with red and aqua signals approximated (ERG 3′–TMPRSS2 fusion, thick arrows (d, f)). In other cases, rearrangement was associated with a red–aqua signal doublet, with loss of the corresponding green signal (g). A subset of cases with and without rearrangement demonstrated copy number gain at the 21q22 locus (h).

