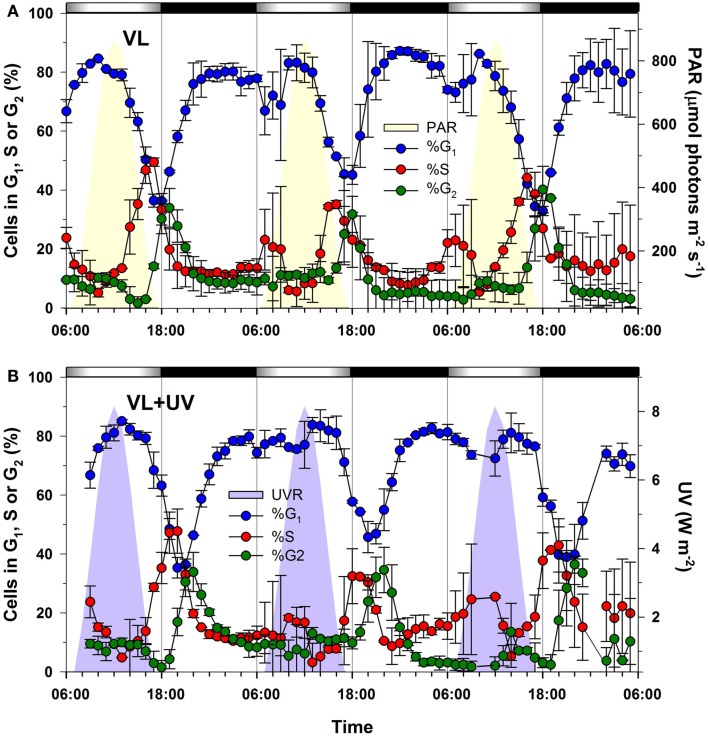
Figure 1.
Effect of UV exposure on the timing of the cell cycle phases of Synechococcus sp. WH7803 cells grown over a modulated 12/12 h L/D cycle with or without UV radiations. (A) Distribution of G1 (blue), S (red), and G2 (green) phases for cells acclimated to VL. (B) Same for VL + UV conditions. Error bars indicate mean deviation for two biological replicates. Note that only the total UVR (UV-A + UV-B) plot is shown in graph (B) since PAR was the same as in graph (A). White and black bars above graphs indicate light and dark periods, also delineated by gray vertical bars and areas filled in yellow (PAR) or purple (UV). Abbreviations: L/D, light/dark; PAR, photosynthetically available radiations; VL, visible light; UV, ultraviolet.

