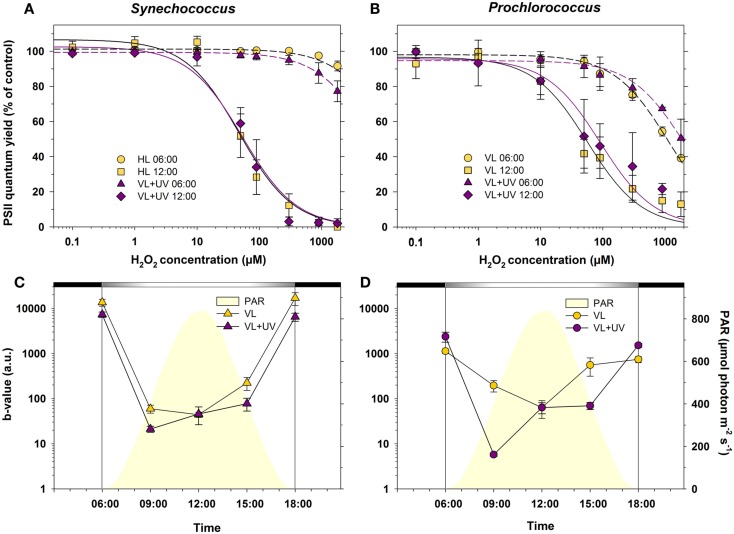
Figure 6.
Daily variations of photosystem II (PSII) resistance to oxidative stress for picocyanobacterial cells acclimated to a modulated 12/12 h L/D cycle of high visible light with or without UV radiations. (A,B) Maximal PSII quantum yield (FV/FM) measured at 06:00 and at noon, after 50 min exposure to a range of H2O2 concentrations of Synechococcus sp. WH7803 (A) or Prochlorococcus marinus PCC 9511 cells (B). Data were fitted with a two-parameter hyperbolic decay function. (C,D) PSII resistance to oxidative stress in Synechococcus (C) and Prochlorococcus (D) cells, as estimated by the b-value (see Materials and Methods). White and black bars above graphs (C,D) indicate light and dark periods, also delineated by vertical bars and areas filled in yellow. Data represent the mean ± standard deviation (n = 4) of two biological replicates and two consecutive days. Abbreviations as in Figure 1.

