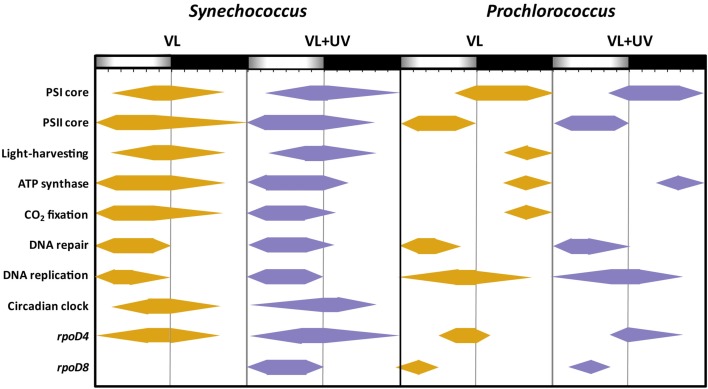
Figure 8.
Scheme of the daily patterns of gene upregulation for several important functional for picocyanobacterial cells acclimated to a modulated 12/12 h L/D cycle of high visible light with or without UV radiations. This figure, derived from Figure 7, shows for each individual the time intervals during which they were significantly upregulated [|log2 (Fold Change)| > 1.0], with regard to the expression level measured at 6:00 in VL.

