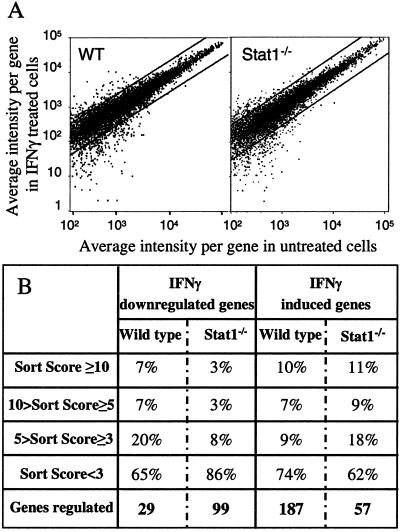
Figure 4.
Many genes are regulated by IFNγ in Stat1−/− macrophages. Biotin-labeled cRNA samples were prepared from Stat1−/− and WT BMM, unstimulated or stimulated for 60 min with IFNγ (14 ng/ml). After hybridization to an Affymetrix oligonucleotide array complimentary to more than 11,000 mouse genes and Expressed Sequence Tags (ESTs), and staining and scanning of the arrays, the data were analyzed with the Affymetrix software. This experiment was performed three times [twice with the 6,400 and once with the 11,000 (11k) GeneChips], using freshly prepared RNA for each experiment, with similar results. (A) Representation of the average differences (relative indicator of the level of expression of a transcript) for the untreated- and IFNγ-treated WT and Stat1−/− BMM. The plots contain only those genes that showed an average difference of greater than 100 compared with the untreated sample. Each graph represents the changes observed for ≈8,500 genes. (B) Comparison of IFNγ-dependent gene regulation in WT and Stat1−/− BMM, assessed by using the sort score, a parameter based on a combination of the relative change in mRNA expression levels and the intensity differences shown for a specific gene after IFNγ stimulation.

