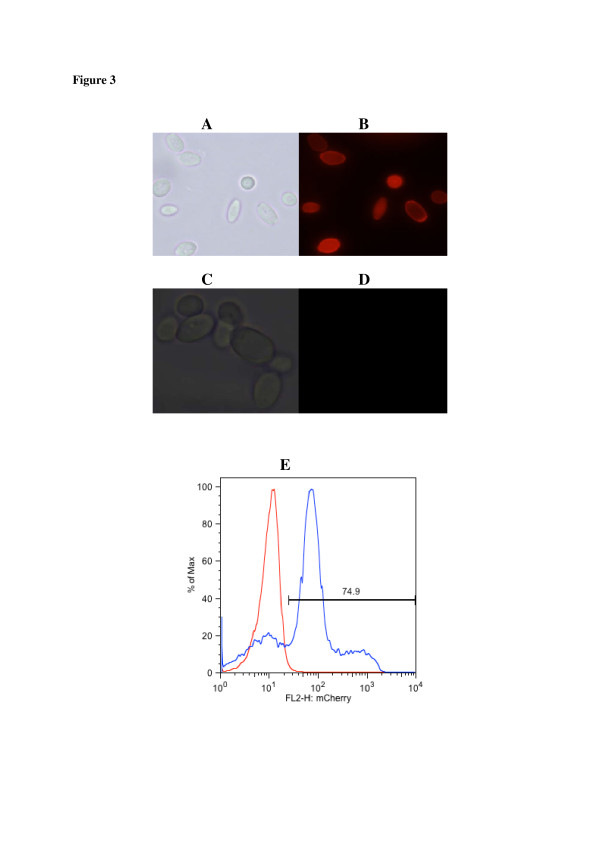
Figure 3.
Microscopic and flow cytometric photographs ofY. lipolyticacells transformed with pKOV410-mCherry-YlCWP1(A & B) and pKOV410-YlCWP1(C & D) expression cassettes.Y. lipolytica cells in A and C were photographed under visible light and the cells in B and D were photographed under UV light (492 nm). Flow cytometry histograms shown in ( E) depict the mean fluorescent signal of mCherry displayed on Y. lipolytica cells (in blue) and control cells (in red).

