Figure 1.
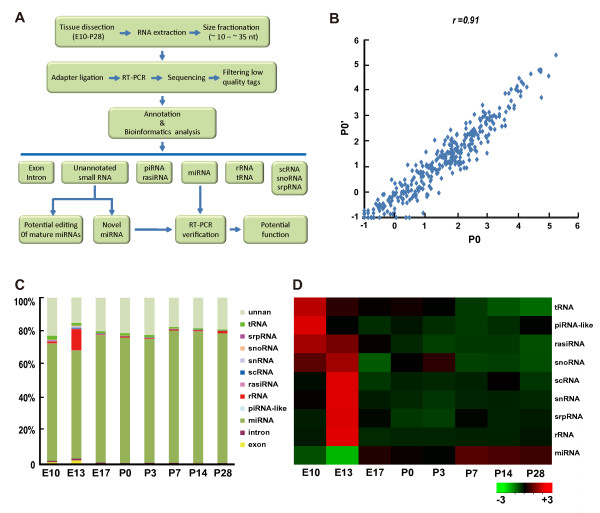
Overview of deep-sequence results.A. Flow chart of the study. Briefly, RNAs were extracted from rat cortical tissues of different developmental stages, size selected, and then sequenced by using the Solexa 1 G genome analyzer. Clean read tags were annotated by different bioinformatics softwares (see methods). B. The comparison of read numbers per miRNA between the two P0 samples. Since the read number per miRNA ranges from 0 to >10,000, the read number adding 1 was transformed by log10. Each dot represents data from one miRNA. There is a high correlation between the two sequencing results (r = 0.91, Pearson’s correlation; p < 0.001(two tail). C-D. Relative abundances of different classes of small RNAs. The chart (C) show the relative levels of each of the nine classes of small RNAs at different developmental stages. There were <3% reads coming from the degradation of mRNAs (exon and intron). The heat-map (D) shows the developmental tendency of the total amount of each class of small RNAs. Red and green indicate high and low expression, respectively.

