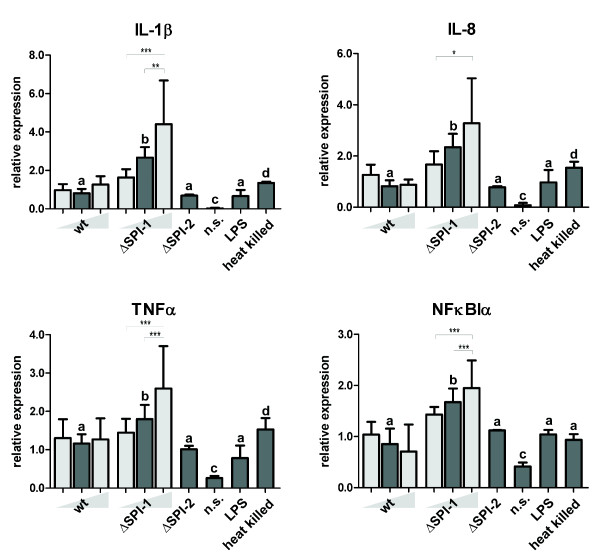
Figure 2.
M1-related gene expressions. Dark grey columns represent M1-related gene expression in PAMs 24 hours post infection with the wild-type Salmonella Typhimurium, ΔSPI-1 and ΔSPI-2 mutants using MOI = 10. Stimulation with LPS from Salmonella Typhimurium (1 μg/ml), heat killed Salmonella Typhimurium and non-stimulated cells (n.s.) were used as controls. Significantly different groups (P < 0.05) are marked by different letters (“a” differs from “bc”, but not “ab”, etc.). Light gray columns represent data for different MOI (=2.5 and 40) of wt strain and ΔSPI-1 mutant. The statistical significances are marked only among the groups infected with different MOIs of the same strain. The significance levels are as follows 0.05 (*), 0.01 (**), and 0.001 (***). Data are presented as mean and SD.

