
Figure 4 .
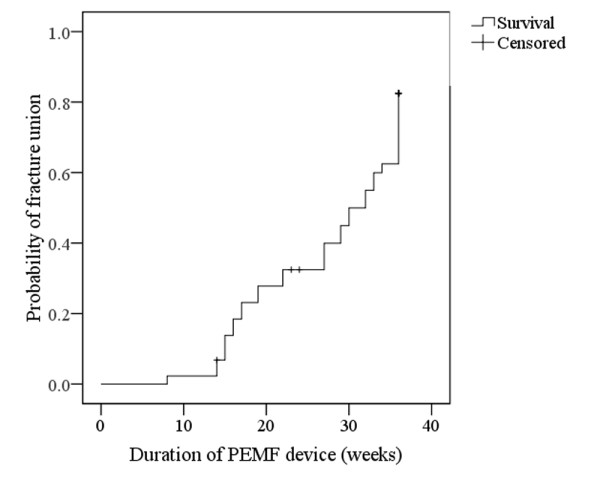
Kaplan-Meier recurrence curve of patients treated with PEMF. Line represents probability of fracture union in relation to the duration of PEMF treatment (weeks). Crosses represent censored cases where follow-up was stopped because union was deemed unlikely with conservative management.