
Figure 2.
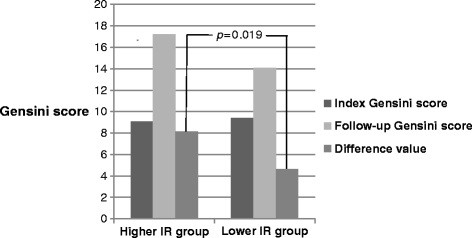
Comparison of Gensini scores between the higher IR group and lower IR group at the initial/follow-up visits.p<0.05 was considered statistically significant. Different colors represent different variables as listed on the right. Both index and follow-up Gensini score remained similar between the higher and lower IR groups (9.09 ± 14.33 versus 9.44 ± 12.88, p = 0.813 and 17.21 ± 18.46 versus 14.09 ± 14.18, p =0.358) while the difference value was significantly elevated in the higher than the lower IR group.