
Figure 3.
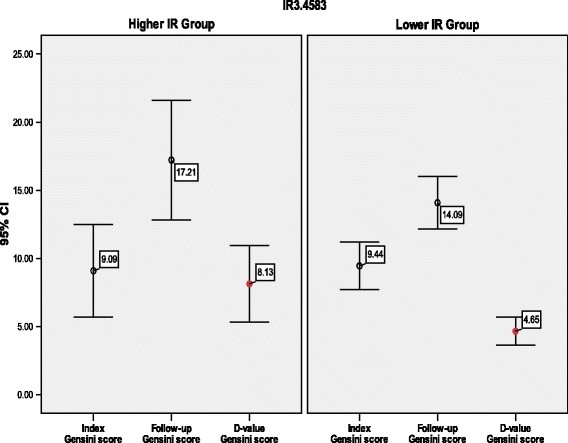
Error bars demonstrating differences in index and follow-up Gensini score between the Higher and Lower IR group. Each error bar represents a variable as listed on the X axis. The Y axis demonstrates the 95% confidence interval of each different Gensini score, including its mean value and standard deviation. The red circle indicates that difference value of Gensini score was statistically significant (8.13 ± 11.83 versus 4.65 ± 7.58, p = 0.019).