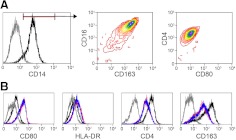
Figure 3. NFV fails to alter LPS-induced macrophage surface protein phenotype.
Expression of cell surface proteins was determined by flow cytometry. (A) Representative phenotype of resting macrophages (left panel: gray, isotype control; black, anti-CD14; middle and right panels are gated on CD14+ cells). (B) Representative phenotype of resting MDMs (black), MDMs activated with 100 pg/ml LPS for 18 h (red), or MDMs pretreated with 10 μM NFV before activation with 100 pg/ml LPS for 18 h (blue). Isotype control antibody staining of resting MDM (gray).

