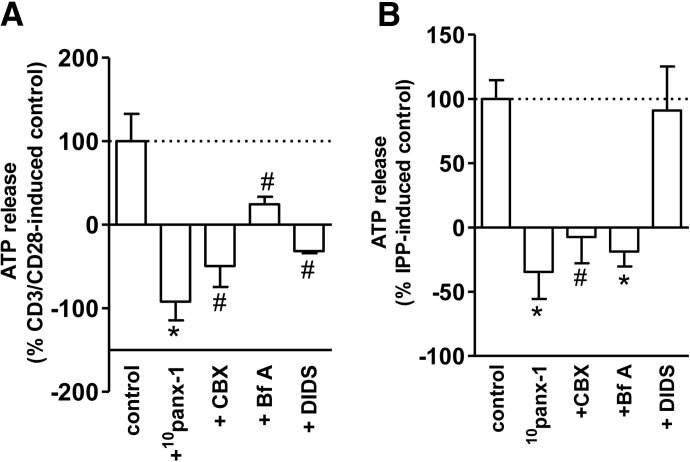
Figure 2. γδ T cells release ATP through panx-1 and/or connexin hemichannels, as well as vesicular exocytosis.
Purified γδ T cells were pretreated for 20 min with 10panx-1 (400 μM), CBX (25 μM), Bf A (50 nM), or DIDS (200 μM) and then stimulated with anti-CD3/CD28-coated beads (one bead/cell; A) or IPP (25 μM; B) for 30 s. The increase in ATP concentration in the culture supernatant was measured with an ATP bioluminescence assay kit as described in Fig. 1. ATP release data are expressed as percentage of the ATP release by control cells stimulated in the absence of inhibitors. Basal ATP concentrations in culture supernatants of unstimulated cells were 87 ± 7 nM. Data shown are averages ± sd; n = 3; #P < 0.05; *P < 0.01 as compared with control.

