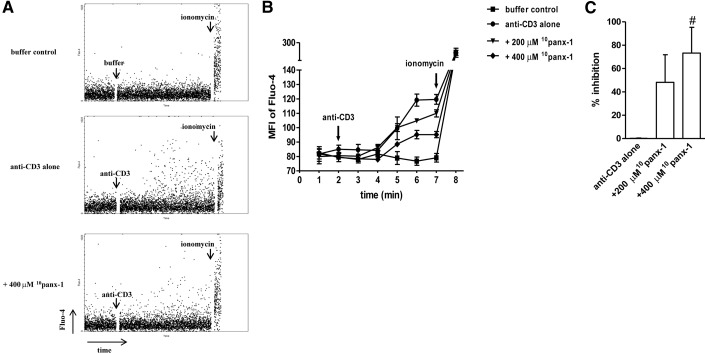
Figure 3. Blockade of panx-1 inhibits anti-CD3-induced Ca2+ signaling in γδ T cells.
Human PBMCs were loaded with Fluo-4 and labeled with anti-γδ TCR-APC antibodies, and Ca2+ signaling, in response to anti-CD3 (1 μg/ml) in the absence or presence of the indicated concentrations of 10panx-1, was recorded with flow cytometry. Baseline and maximum intracellular Ca2+ concentrations were determined using buffer control and ionomycin, respectively. Representative dot plots of Fluo-4 MFI readings over time (total duration: 512 s) are shown in A, and averaged data of a representative experiment are depicted in B. Arrows indicate the time-points at which buffer, anti-CD3, or ionomycin was added to the cells. Inhibition of Ca2+ signaling was calculated by combining data sets from three individual experiments (C). Data shown are averages ± sd; n = 3; #P < 0.05 as compared to stimulation with anti-CD3 alone.

