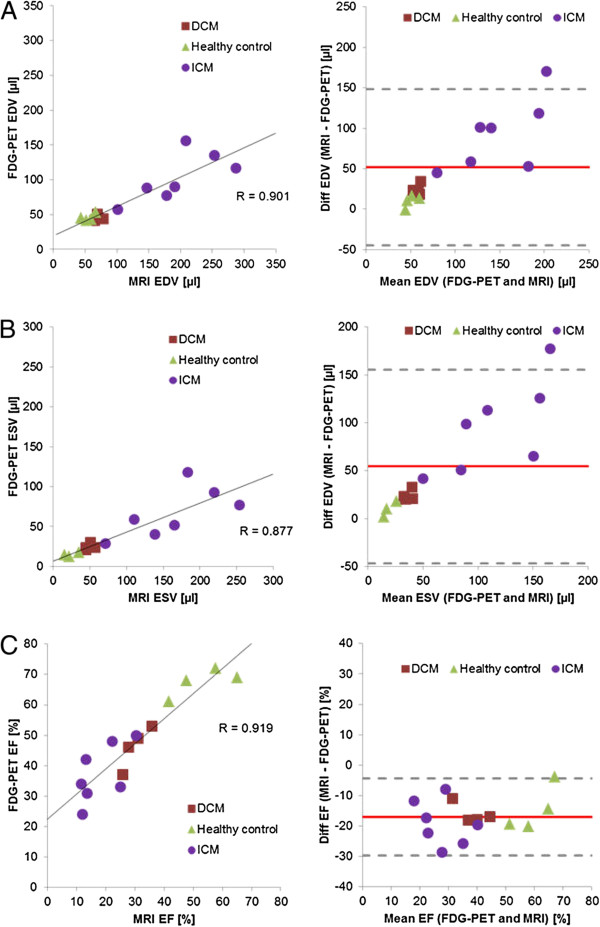
Figure 2.

Scatter plots of the relationship between measurements of LV parameters. Correlations between LV-functional parameter measurements within the entire study group by FDG-PET and by MRI for all animals (left hand side). alongside the corresponding Bland-Altman-plot (right hand side) for all animals, for the cases of (A) EDV, (B) ESV and (C) LVEF.
