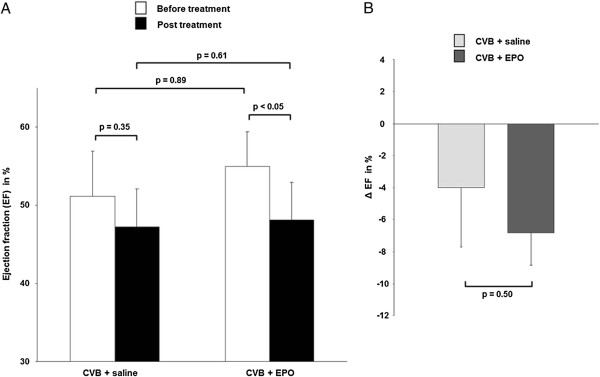
Figure 4.

Monitoring EPO treatment with ECG-gated FDG-PET. (A) The mean magnitude of LVEF before (white bars) and after (black bars) treatment with saline vs. EPP, and (B) the change in LVEF (Δ EF) for the saline and EPO groups during 1 month of treatment.
