
Figure 5.
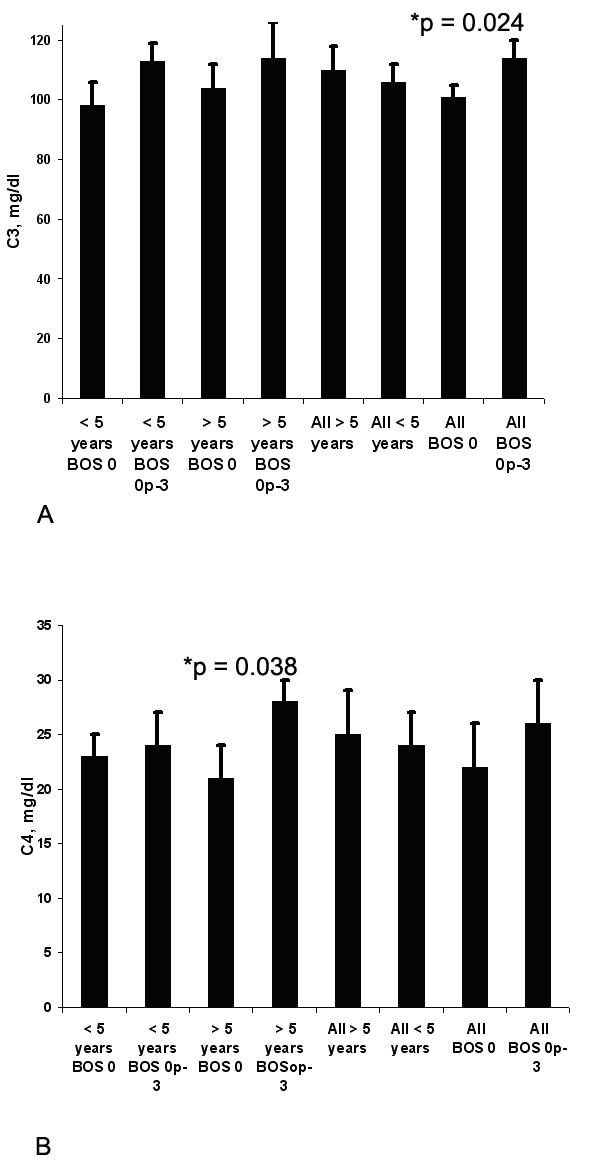
Comparing all patients with BOS 0 (n = 29) vs. BOS Op-3 (n = 36), BOS 0 patients had significantly lower C3, 104 mg/ml vs. 114 mg/ml, p = 0.024, respectively, A. Within the long-term survivors cohort, patients with BOS 0 (n = 12) had significantly lower levels of MBL and C4 compared to those with BOS Op-3, C4 level 21.6 mg/ml vs 28.7 mg/ml, p = 0.038, B.