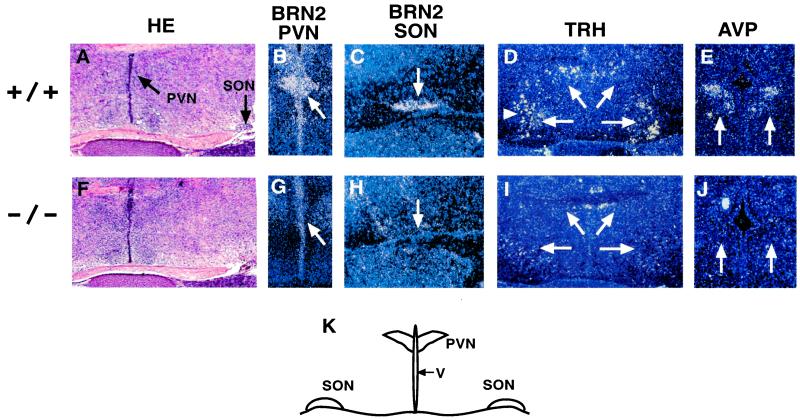
Figure 2.
RNA in situ hybridization analysis of PVN and SON of Arnt2+/+ and Arnt2−/− E18.5 embryos.(A and F) Hematoxylin and eosin staining of Arnt2+/+ coronal hypothalamic sections. Arrows indicate PVN and SON. Hybridization patterns of Brn2 (B, C, G, and H), Trh (D and I), and Avp (E and J) transcripts in Arnt2+/+ (upper row) and Arnt2−/− (lower row) embryos are shown. For each probe, note decreased signal intensity in Arnt2−/− embryos relative to Arnt2+/+ embryos (arrows). (K) Schematic diagram of coronal section, outlining the third ventricle (V), PVN, and SON. (A and F, ×50; B–E and G–J, ×100.)

