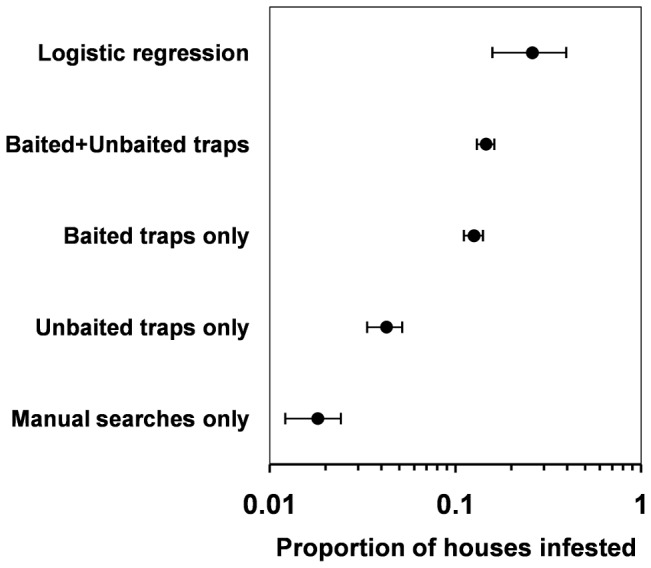
Figure 3. Dwelling infestation rates after three months of trap operation.

Top-bottom: infestation estimate from a simple logistic regression model taking detection failures into account; infestation index after combined observations from chemically-baited and unbaited sticky traps; infestation index after observations only from chemically-baited sticky traps; infestation index after observations only from unbaited sticky traps; and infestation index after observations only from manual searches by trained staff. Solid circles are point estimates/proportions, and short vertical lines are the 95% confidence interval limits; in the case of observed proportions, these limits were estimated using the Agresti-Coull method [22]. Note that the x-axis is in log10 scale.
