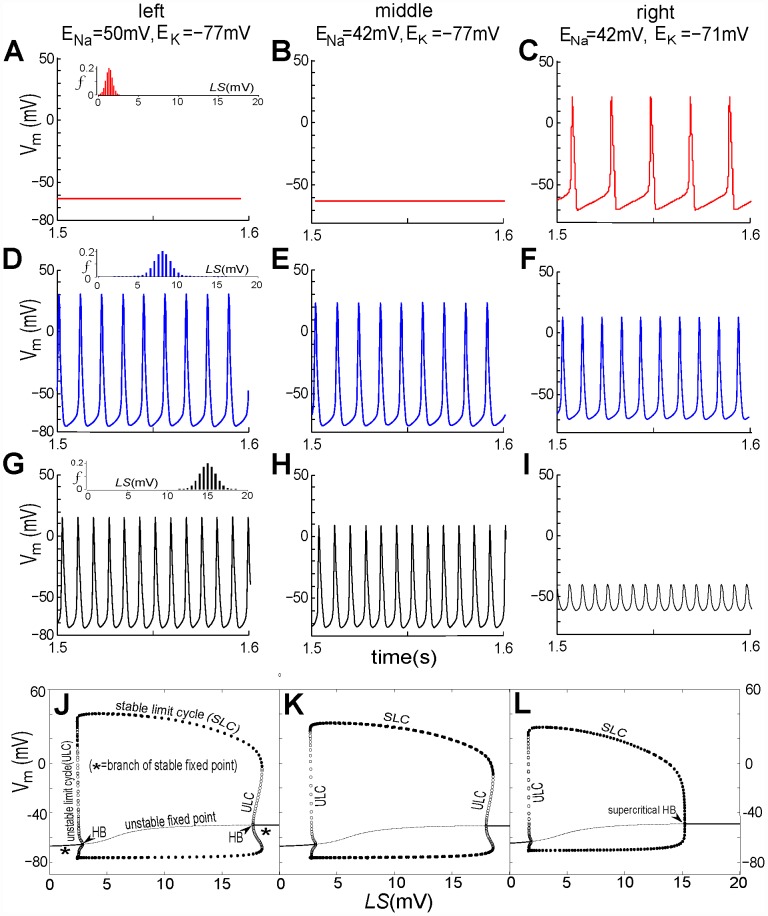
Figure 2. Nav-CLS induced spontaneous activities of injured node: steady state with fixed EIon, tonic spiking, tonic subthreshold oscillations (STOs).
By setting Imaxpump, gNaleak, and gKleak to zero and eliminating Eqs (11) and (12), the EIon are artificially maintained at fixed values. Three sets of values are considered: left column, ENa = 50 mV, EK = −77 mV; middle column: ENa = 42 mV, EK = −77 mV; right column: ENa = 42 mV, EK = −71 mV. For the first 3 rows, Nav-CLS have Gaussian distributions (mean±SD): (A,B,C) 1.3±0.4 mV; (D,E,F) 8±1 mV; (G,H,I) 15±1 mV. For the last rows,(J,K,L) bifurcation diagrams (solution of Vm in terms of LS) are plotted, and there, for computational tractability, single gNa populations (i.e. f = 1, no Gaussian “smears”) are used. As labeled, the solid line, dashed line, filled dots, open dots and “HB” respectively denote: stable fixed point (i.e. resting potential (RP)), unstable fixed point, stable limit cycle (SLC, i.e., tonically firing APs), unstable limit cycle (ULC) and Hopf bifurcation point (HB). When ENa alone changes (J to K), the bifurcation structure shows only slight changes in the amplitude of SLC and the locations of subcritical HB on both ends. When EK changes (K to L), the HBs on both ends shift to the left (i.e. towards relatively smaller ENa) and the previously subcritical HB (right side) becomes supercritical. Across the 3 columns, note that if the system did have pumps, interactions between the EIon and Ipump would continually and slowly change EIon thereby repeatedly evoking these activity patterns.

