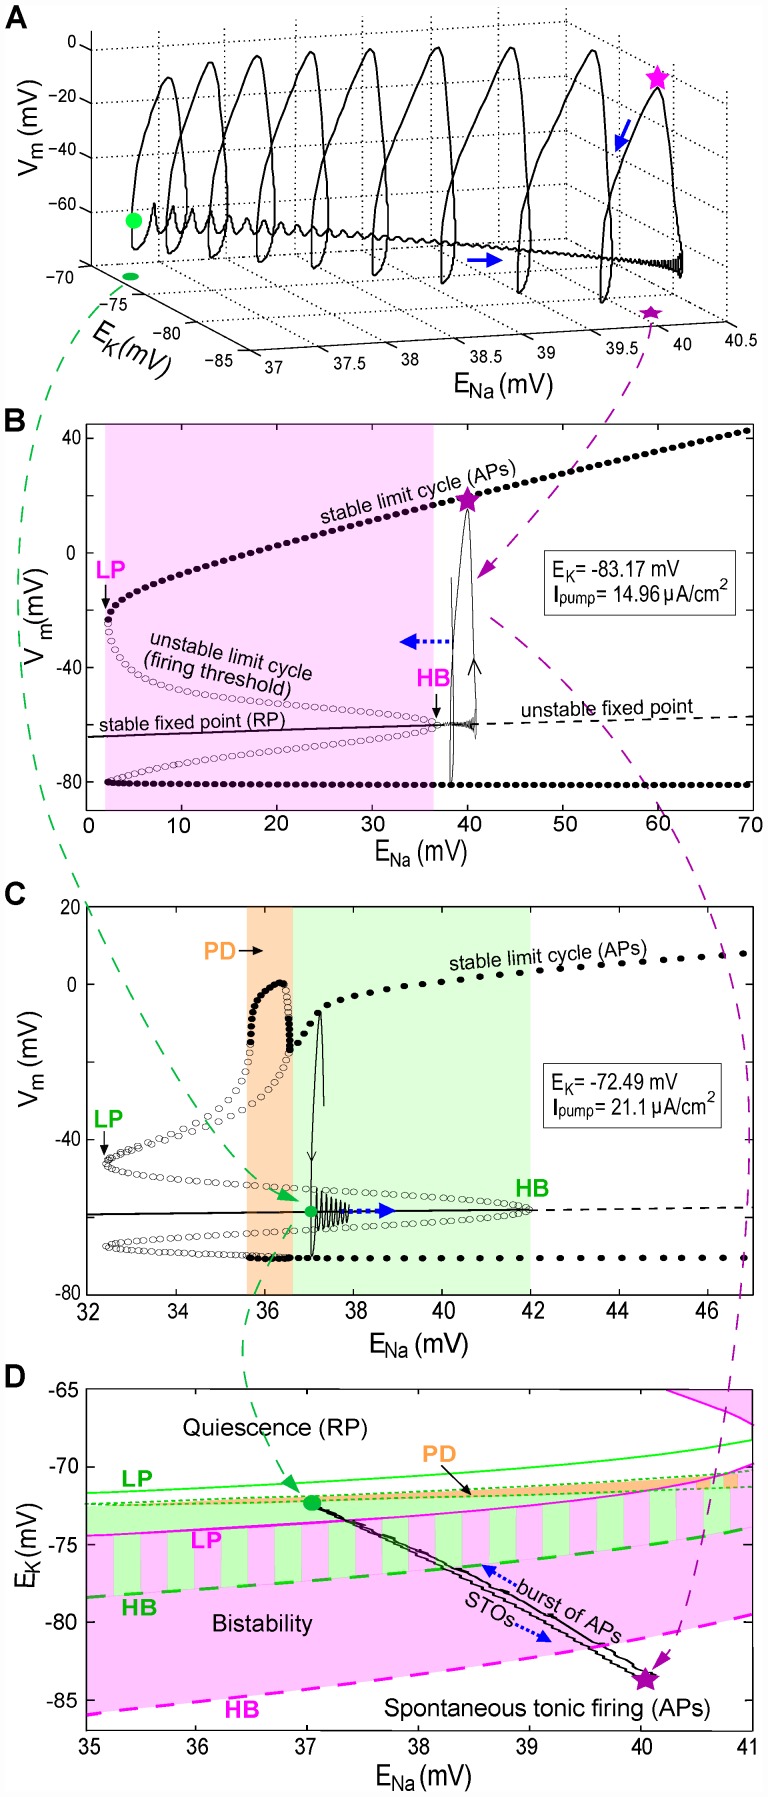
Figure 5. Burst dynamics explained with three-dimensional Vm trajectories and bifurcation diagrams.
(for bursts in Figure 4A with Imaxpump = 95 µA/cm2). Note: x-axis scales are different is each plot. (A) The first burst of spikes in Figure 4A plotted as a function of time are now plotted in 3-D as a function of ENa and EK (blue arrow: direction of Vm trajectory). (B) Bifurcation diagram for fixed EK and Ipump as per Figure 4A pink star; ENa is the slowly varying parameter. Lines and points are labeled (see also abbreviation list) and have the same meanings in (C). For ENa at its Figure 4A pink star value (40.2 mV), the only stable solution is a periodic orbit (pink oval), with each cycle corresponding to a spike (in a burst). The oval-loop symbolizes one cycle of Vm oscillation at fixed ENa. During a burst the ENa decline shifts orbits leftward into the bistability regime (pink area) where there exist two stable solutions: a limit cycle and a stable fixed point. (C) Bifurcation diagram for EK and Ipump fixed as per Figure 4A green dot. For ENa at its Figure 4A green dot value (37.27 mV), the system (large green dot) is within the bistability regime (green area). Vm, attracted by this fixed point, has STOs (drawn as the green loop) until ENa increases and superthreshold-oscillations (spikes) return. The PD region corresponds to period-doubling bifurcations. (D) Two-parameter phase diagram for EK and ENa. Pink solid and dashed curves represent LP (saddle-node bifurcation) and HB, respectively, when Ipump is fixed as in B. The green solid, dashed, and dash-dotted curves represent LP, HB and PD, respectively, when Ipump is fixed as in C. With varying Ipump the bistability regime shifts from the pink to the green area (the zone with both colors is the overlap of these two areas). The gray area between two green dash-dotted curves is a zone with PD bifurcations. The black loop shows EK and ENa orbits during a burst.

