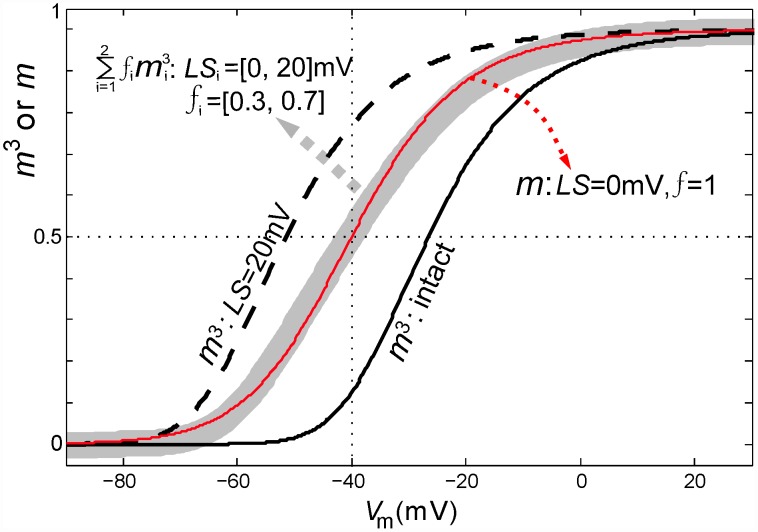
Figure 10. Partial Nav-CLS in a population and apparently first order activation kinetics.
Equilibrium activation values (m3,  and m ) of co-existing intact Nav and CLS Nav channels plotted as a function of Vm. Black solid and black dashed line represent m3 for intact and 20 mV CLS channels with f = 1. For a membrane with large Nav-CLS injury given by: LSi = [0,20]mV and fi = [0.3,0.7], the gray bold line denotes
  . Red line: m of the intact channels.

