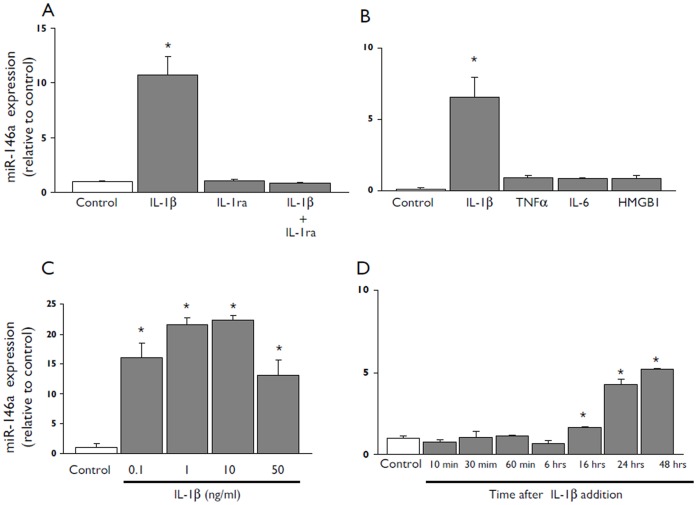
Figure 3. miR-146a expression levels in cultured human astrocytes after exposure to IL-1β.
Quantitative real-time PCR of miR-146a expression in human fetal astrocytes in culture. (A) Expression levels of miR-146a 24 hours after exposure to IL-1β (10 ng/ml) or LPS (100 ng/ml) in the presence or absence of the IL-1β receptor antagonist (IL-1ra; 1 µg/ml) or LPS-RS (10 µg/m) respectively. (B) Expression levels of miR-146a 24 hours after exposure to IL-1β (10 ng/ml), TNFα (1 ng/ml), IL-6 (10 ng/ml), HMGB1 (40 nM). (C) Expression levels of miR-146a 24 hours after to 0.1, 1, 10 or 50 ng/ml of IL-1β. (D) Expression levels of miR-146a in cells incubated for different times (10, 30, 60 min and 6, 16, 24, 48) hours in the presence of IL-1β (10 ng/ml). Data are expressed relative to the levels observed in unstimulated cells and are mean ± SEM from two separate experiments performed in triplicate (*p<0.05 compared to control).

