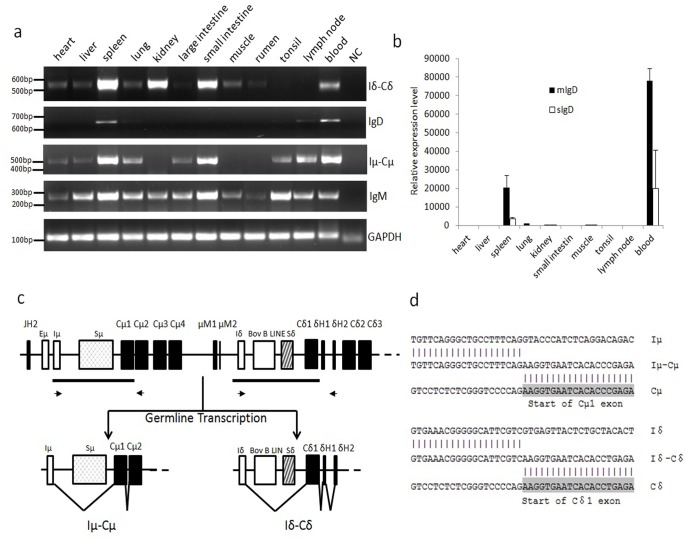
Figure 3. Transcription of the bovine μ and δ genes in different tissues.
(a) RT-PCR detection of the IgD, Iδ germline, IgM and Iμ germline transcripts in different tissues. GAPDH was used as an internal control. (b) Q-PCR analysis of mIgD and sIgD in different tissues. Data were analyzed using the ΔΔCT method. GAPDH was used as an internal control. (c) Germline Iμ-Cμ and Iδ-Cδ transcripts. Lower thick lines indicate homologous DNA fragments, whereas arrows indicate primers for Iμ and Iδ germline transcripts. (d) Sequence of Iμ-Cμ and Iδ-Cδ transcripts from the spleen.

