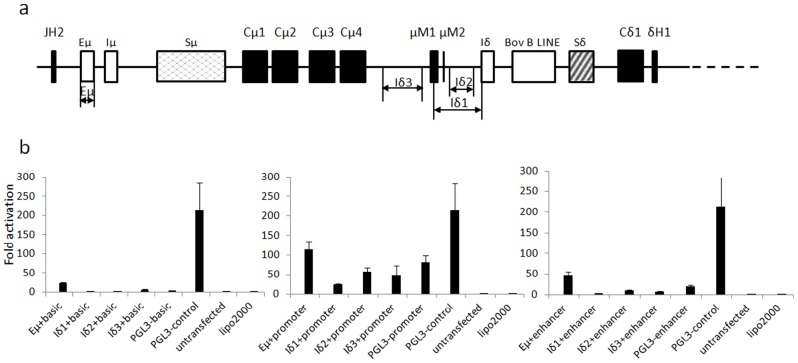
Figure 5. Promoter activity analysis of the sequences upstream of the Iδ exon.
(a) Schematic positions of the cloned fragments tested for promoter activity. Eμ has been previously described [27]. Eμ, Iδ1, Iδ2 and Iδ3 indicate the cloned fragments. (b) Detection of the promoter or enhancer activity in X16C8.5 B cell lines. Eμ, Iδ1, Iδ2 and Iδ3 were separately cloned into the pGL3-basic, pGL3-promoter and pGL3-enhancer vectors and named Eμ+basic, Eμ+promoter and Eμ+enhancer, respectively. pGL3-control was a positive transfection control. pGL3-basic, pGL3-promoter, pGL3-enhancer and untransfected cells were used as the controls. The average values of three replicates and standard deviations are shown.

