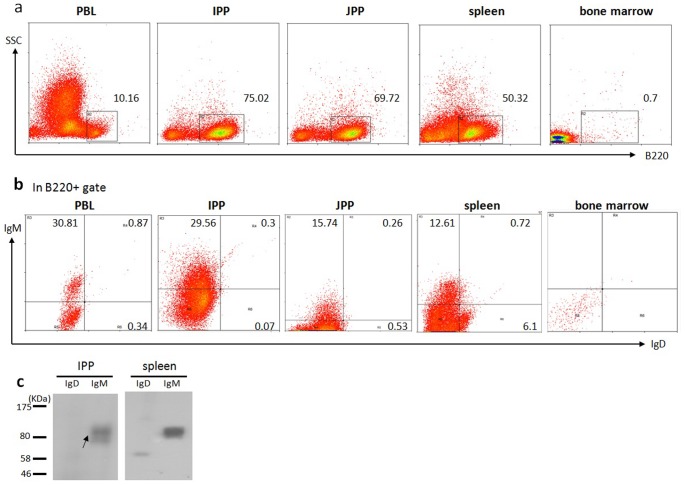
Figure 8. Flow cytometric analysis of B cell populations in the PBLs, ileum PP, jejunum PP, spleen and bone marrow from a 1- year-old cow.
(a) Cells were stained for B220, and the proportion of cell populations are indicated for each gate. (b) FACS analysis of lymphocytes from the PBLs, IPP, JPP, spleen and bone marrow using FITC-conjugated anti-bovine B220, PE-conjugated anti-bovine IgD (13C2) and biotin-labeled anti-bovine IgM plus PE/Cy5-labeled streptavidin. Numbers adjacent to the outlined areas indicate the percent of IgM+ cells or IgD cells in the B220 gate. (c) Western blotting of membrane proteins extracted from the ileal PP and spleen of the same cow using anti-bovine IgD and anti-bovine IgM separately. Note: three animals were used in this experiment, but only representative data from one animal are shown.

