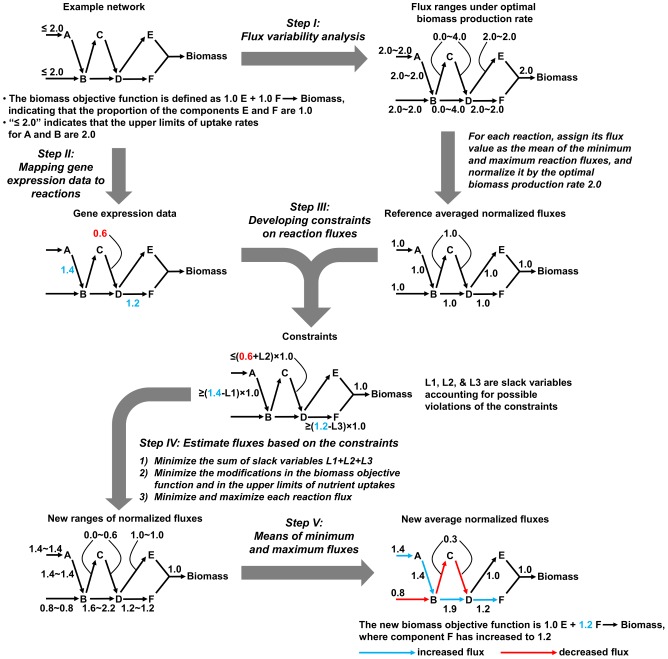
Figure 1. Schematic description of integrating a small example metabolic network with gene expression data.
Construction of the altered metabolic state used gene expression data to constrain and alter the reference fluxes obtained from a metabolic network compatible with the reference condition. The example network contained six metabolites (A–F), two uptake reactions, six enzymatic reactions, and one biomass reaction. In the reference condition, the biomass function contained equal amounts of metabolites E and F, set to 1.0 millimoles per gram dry weight of the organism (mmol/gDW), and the uptake rates for the metabolites A and B were each assigned an upper limit of 2.0 mmol/(h·gDW). In Step I, we obtained the minimum and maximum fluxes under the optimal biomass production rate via flux variability analysis and calculated the average normalized flux for the reference metabolic network. In Step II, the gene expression ratios were mapped to their corresponding reactions. In Step III, we initially set constraints for reactions that were associated with altered gene expression values. These constraints were based on the normalized reference network with the biomass production rate set to one and resulted in increased normalized fluxes through reactions related to up-regulated genes (reactions A→B and D→F) and decreased fluxes related to down-regulated genes (reaction C→D). Because biological activities other than gene transcription can influence reaction fluxes, we introduced a set of non-negative slack variables (L1, L2, and L3) to account for possible violations of the constraints. In Step IV, we further performed a number of optimizations subject to the constraints from the previous step and obtained a new minimum and maximum normalized flux for each reaction. We first minimized the overall violation of the developed constraints in the form of the sum of the slack variables (highest priority). We then minimized the modifications in the biomass objective function and those in the upper limits of metabolite uptakes (medium priority), and, last, we minimized and maximized each reaction flux (lowest priority). Finally, in Step V, we constructed the new metabolic state by calculating the new average normalized flux for each reaction as the mean of its new minimum and maximum fluxes. This metabolic state was representative of the new condition and in this case was associated with altered uptake rates, pathway preferences, and an altered biomass composition.

