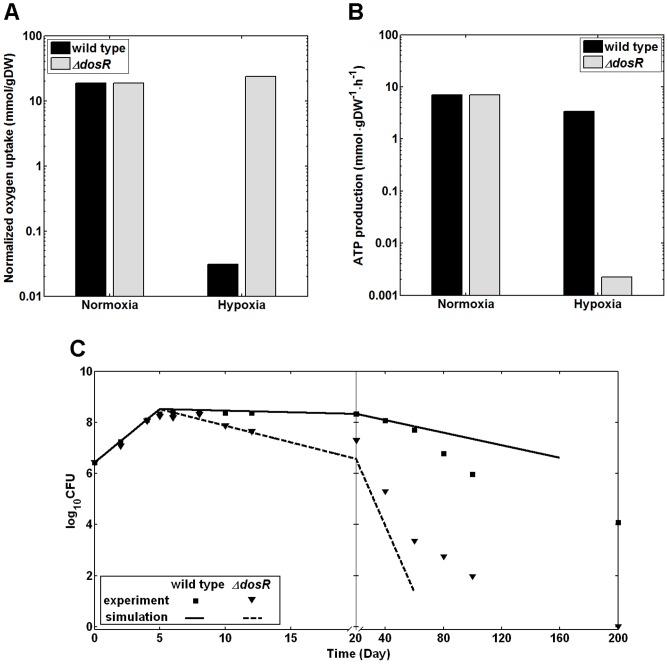
Figure 2. Phenotypic characteristics of wild type Mycobacterium tuberculosis H37Rv and ΔdosR under normoxia and hypoxia.
(A) The predicted normalized oxygen uptake rates of Mycobacterium tuberculosis H37Rv and the ΔdosR deletion mutant under normoxia and hypoxia. The oxygen uptake rates were normalized by each strain's biomass production rate. Supplemental Table S1 gives the biomass production rates of each strain under different conditions, which were calculated as described in the Materials and Methods Section. We based the metabolic network models of the hypoxic state on differential gene expression data associated with the change from normoxic air to hypoxic nitrogen gas with 0.2% oxygen (1.5 mm Hg) after 2 hours [25]. The wild type metabolic response involved reducing its oxygen requirement to cope with the low-oxygen stress, while the ΔdosR deletion mutant was not capable of adjusting. (B) The predicted ATP production levels for the same systems as in panel A showed a slight reduction for the wild type and a much larger decrease for the ΔdosR deletion mutant in response to hypoxia. Note that the ATP production rates were not normalized so to facilitate a direct comparison with the experimental data in Refs. [16] and [49]. (C) The modeled growth characteristic of the wild type and ΔdosR deletion mutant were compared with the corresponding experimental data [49]. Following the experimental data presentation, the x-axis plots two different time intervals, 0–20 and 20–200 days, using two different time scales. The initial aerobic growth phase for the first 5 days was followed by a slight decrease in cell concentration upon switching to hypoxic conditions on day 5. Our metabolic model interpretation was also compatible with a slight decrease in cell concentration for wild type and a substantial decrease for the deletion mutant. Because the gene expression data was compatible with the immediate hypoxic response, the validity range of the metabolic model cannot be expected to capture genotypic and phenotypic adaptations beyond an initial adaptation. Here, the calculated growth reductions for the wild type and ΔdosR deletion mutant mimicked the experimental data up to days 60 and 12, respectively.

