
Figure 3. Variations of oxygen uptake of wild type Mycobacterium tuberculosis H37Rv are compatible with experimental fluctuations.
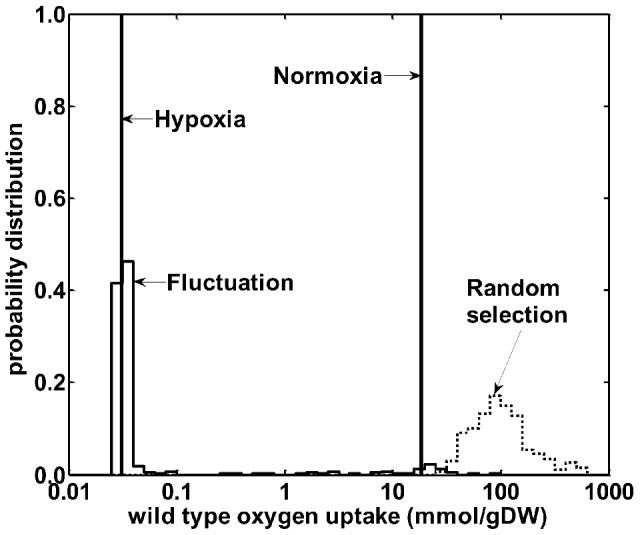
The solid vertical bars indicate the wild type normoxic- and hypoxic-normalized oxygen uptake rates based on our integrated metabolic network model and correspond to the same values given in Figure 2A. We calculated the distribution of uptake values by sampling each expression value from a normalized distribution based on its mean and standard deviation and calculating the resultant uptake rates. This distribution, labeled “Fluctuations” in the graph, captured the experimental gene expression variability and was centered on the value derived from using the mean expression values. In contrast, the distribution labeled “Random selection” was derived from randomizing all gene expression data and was far away from either the normoxic or hypoxic conditions. This confirmed that the gene expression data carried sufficient information to guide the metabolic network model to describe the organism's adaptations under hypoxia. The units are mmol per gram dry weight of Mycobacterium tuberculosis.