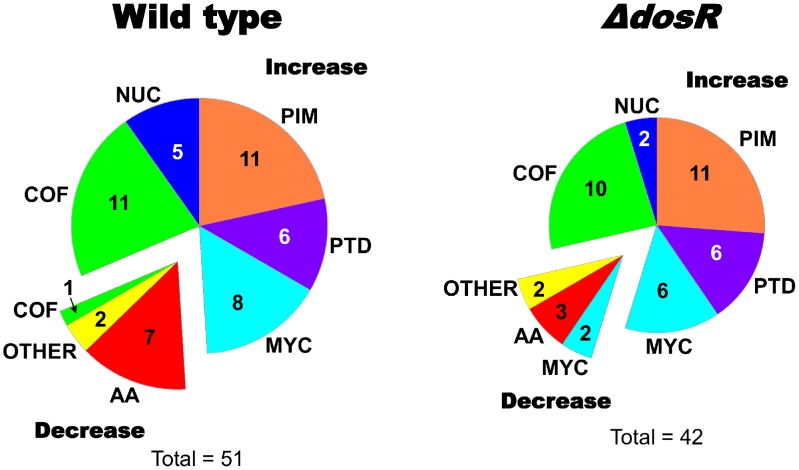
Figure 4. Classification of biomass metabolites predicted to change under hypoxia.
Our metabolic network model predicted different adjustments in the biomass composition of wild type Mycobacterium tuberculosis and the ΔdosR deletion mutant under hypoxic stress. We classified these metabolites into the following categories: amino acids (AA), cofactors (COF), mycolates and related derivatives (MYC), nucleotides (NUC), phosphatidyl-myo-inositol mannosides (PIM), precursors of peptidoglycan (PTD), and other (OTHER). The pie charts indicate the numbers of metabolites that changed in each category. In total, the wild type was associated with 51 changes and the ΔdosR deletion mutant with 42 changes. The top-right portion in each chart represents the metabolites that were predicted to increase under hypoxia, while the bottom-left portion represents those predicted to decrease. Supplemental Table S2 provides detailed information for all predicted biomass composition changes.

