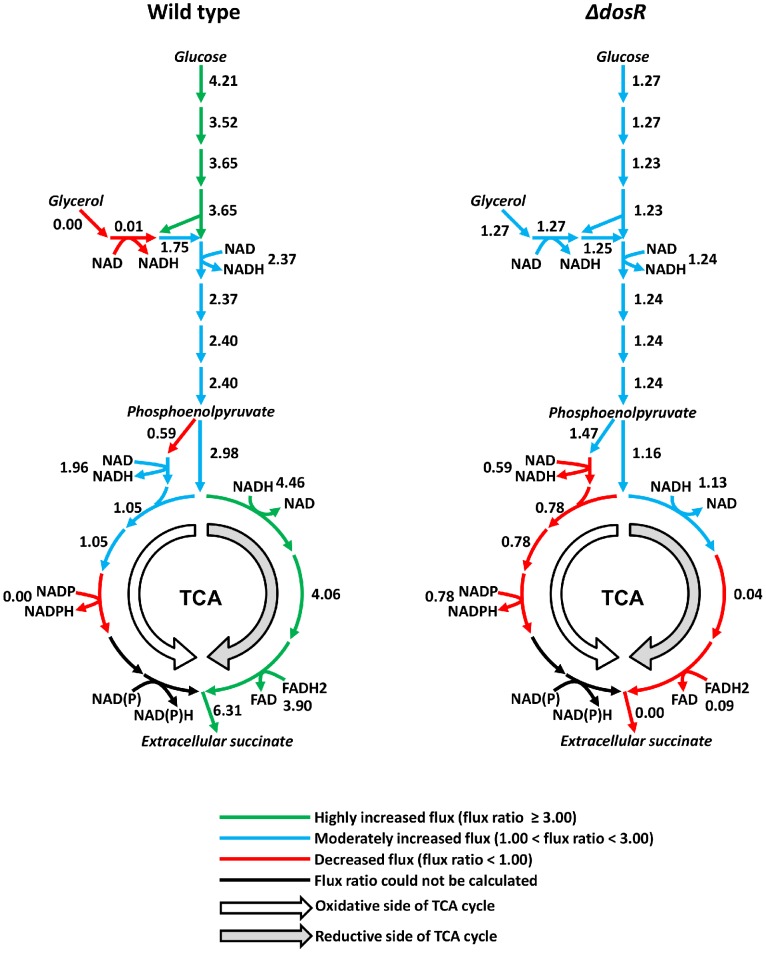
Figure 5. Predictions of hypoxia-induced changes in fluxes through central carbon metabolism.
The left panel shows the flux ratios, i.e., the ratios of reaction fluxes under hypoxia to those under normoxia, of wild type Mycobacterium tuberculosis H37Rv and the right panel shows those of the ΔdosR deletion mutant. If the normoxic flux of a reaction was close to zero, we did not calculate the flux ratio for this reaction due to the numerical uncertainty associated with creating the corresponding ratio. The results indicated that the wild type strain activated glucose processing pathways and the predominant reaction flow was on the reductive side of the tricarboxylic acid (TCA) cycle. Conversely, the ΔdosR deletion mutant was not able to cope under hypoxic conditions as evident by an overall reduced activity in the TCA cycle. NAD, nicotinamide adenine dinucleotide; NADP, nicotinamide adenine dinucleotide phosphate; FAD, flavin adenine dinucleotide. NADH, NADPH, and FADH2 are the reduced forms of NAD, NADP, and FAD, respectively. NAD(P), NAD or NADP; NAD(P)H, NADH or NADPH.

