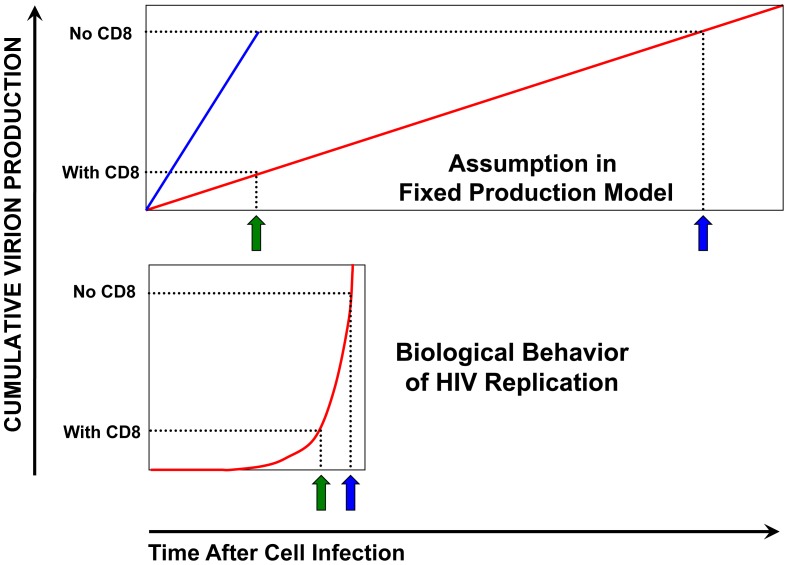
Figure 7. Schematic of different viral replication modeling assumptions.
The assumptions and implications of the fixed production model and the model utilized in the current study are compared schematically: Top: The fixed production model assumes that the amount of plasma virus is always in direct proportion to the number of infected cells, and therefore that infected cells produce virus at a constant rate after infection. Based on the observed viremia decay rate after antiretroviral treatment, the average lifetime of an infected cell is calculated (green arrow). After CD8 depletion, the lifetime of an infected cell would have to increase linearly to explain the increased virus (blue arrow) if shortened lifetime were the mechanism of CTL suppression of viral replication. However, Klatt et al and Wong et al were unable to measure a change in viremia decay rates and therefore assumed that virus production per cell must be increased after removal of CTLs (blue line). Bottom: Our model assumes a non-linear rate of virus production by an infected cell, starting with an eclipse period and then an exponential rise in production, fitting biological observations of viral replication. If CTLs kill the infected cell during the productive phase of infection at baseline (green arrow), loss of CTLs result in a relatively large output in virus production with a small change in the lifetime of the infected cell. Thus the rise in virus production seen after CD8 depletion is consistent with a small change in the lifetime of infected cells, far below the power to detect with a small number of tested macaques.

