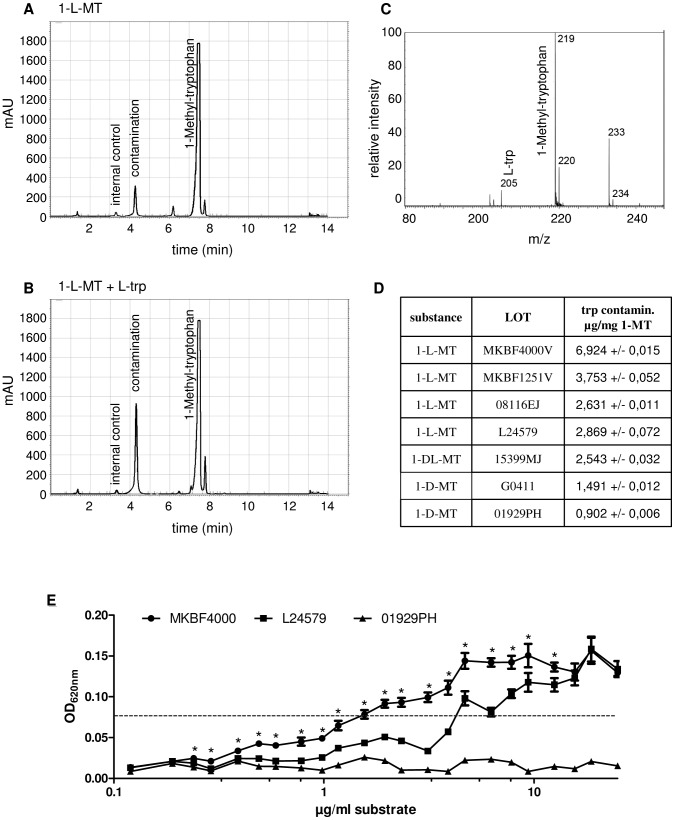
Figure 3. Analysis of 1-L-MT dissolved in tryptophan-free cell culture medium.
(A) Exemplary HPLC chromatogram (lot L24579) showing 1-L-MT peak (at retention time 7.6 min) and “contamination” peak (at retention time 4.2 min). (B) Exemplary HPLC chromatogram of 1-L-MT lot L24579 with supplemented L-tryptophan (L-trp). Note that the L-trp peak appears at the same retention time as the “contamination” peak in A. For both analyses 3-nitrotyrosine (retention time 3.5 min) served as internal control. (C) MS analysis of 1-L-MT lot L24579 dissolved in tryptophan-free cell culture medium. Additional to 1-L-MT with the m/z of 219, also tryptophan with the m/z of 205 was detected. n = 1. (D) Table showing the tryptophan contamination (µg/mg 1-MT) in different 1-MT lots. (E) Diagram revealing the growth of Staphylococcus aureus in tryptophan-free medium in presence of different 1-MT lots. Asterisks indicate that the bacterial growth is significantly higher in the presence of MKBF4000V as compared to L24579.

