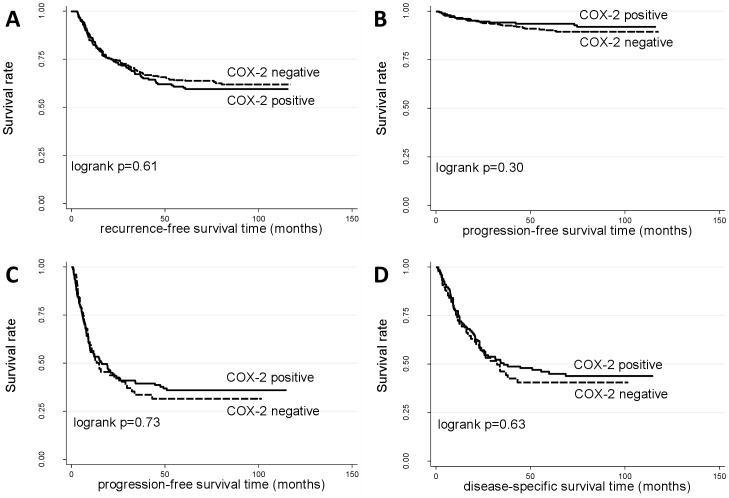
Figure 1. Kaplan-Meier survival curves corresponding to failures in superficial (A, B) and invasive (C, D) tumors for specified prognostic endpoints.
Dashed curves: patients with tumors positive for COX2 protein staining; solid curves: patients with tumors negative for COX2 protein staining. Significance values from two-sided logrank test.

