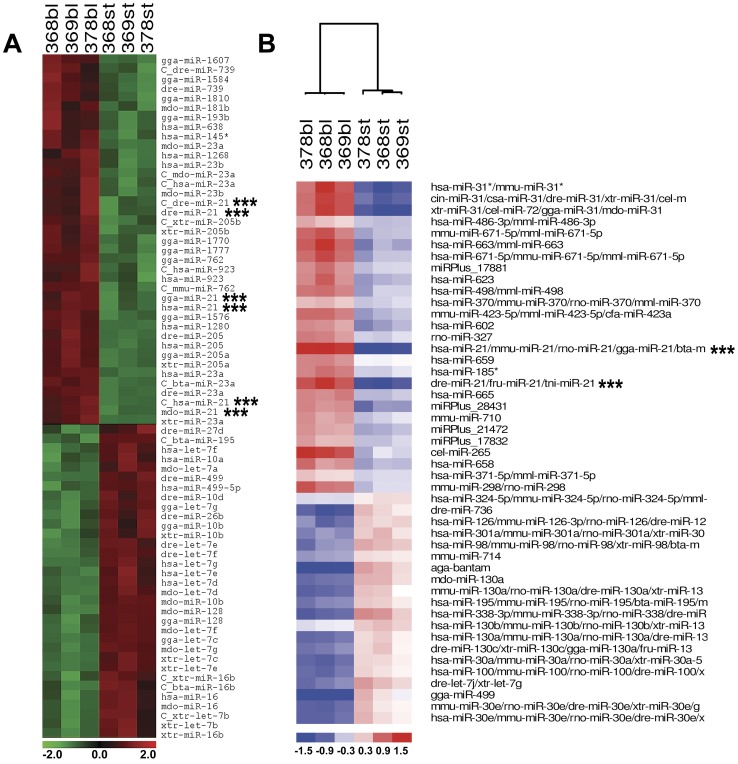
Figure 1. miRNA-microarray profiling of salamander limb regeneration.
Clustering analysis performed on log2 (Cy3/Cy5) ratios, which passed the filtering criteria (p≤0.01 on A and p≤0.001 on B) using a two-tailed t-test between the two groups in the analysis (blastema vs. stump). Heat Map and supervised Hierarchical Clustering of results obtained using LC Sciences (A) and Exiqon's (B) platforms. Each row represents a miRNA and each column represents a sample. Sample clustering shows that the samples (blastema vs. stump) separate into the two discrete groups. The color scale shown at the bottom illustrates the relative expression level of a miRNA across all samples: red color represents an expression level above mean, green and blue color represents expression lower than the mean. Three consecutive asterisks indicate miR-21 probes.

