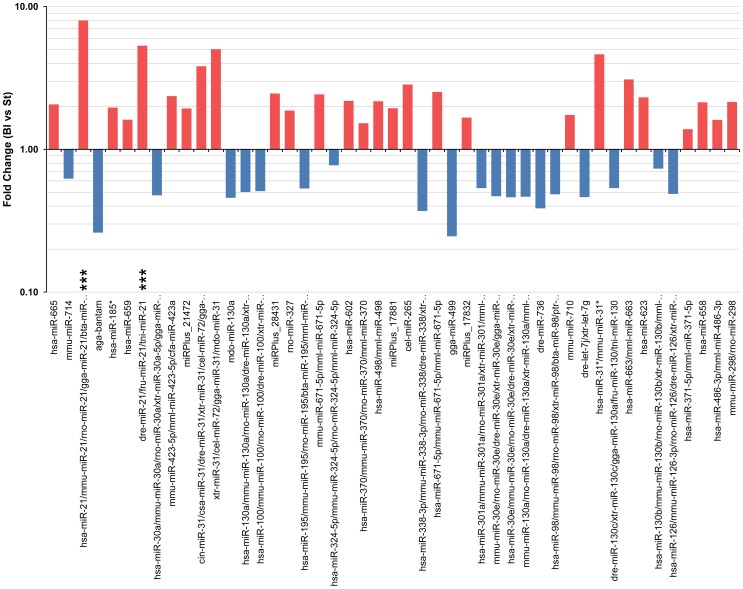
Figure 2. Fold changes of the most significant differentially-expressed miRNAs in salamander limb regeneration.
Differentially expressed microRNAs that passed the filtering criteria on variation across samples (p≤0.001). Each bar indicates the fold change between blastema (Bl) and stump (St) samples. The y-axis is a log scale. A fold change >1 indicates up-regulation in Bl samples (red bars) and a fold change <1 indicates down-regulation in Bl samples (blue bars) compared to St samples. Three consecutive asterisks indicate miR-21 probes.

