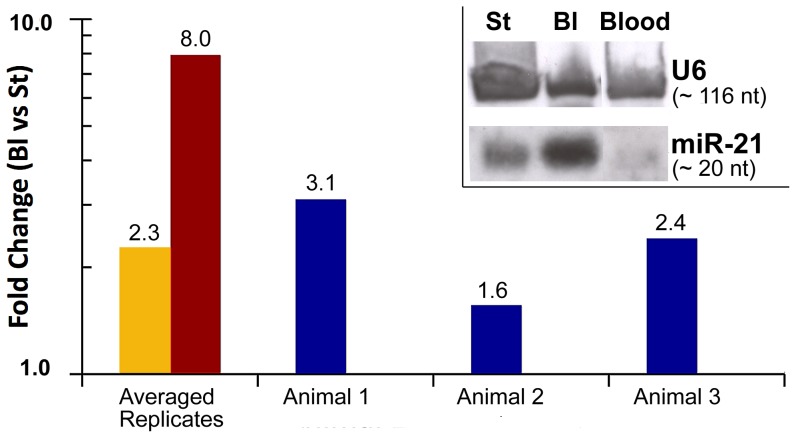
Figure 3. miR-21 expression in axolotl tissues.
Quantitative PCR validates miR-21 microarray results. Two first columns compare the averaged fold change between 17 dpa blastema (Bl) and stump (St) samples for LNA based qPCR assays (yellow bar), and for previous microarray data (red bar). Also, the individual fold changes between Bl and St for the three animals (biological replicates) are shown (blue bars). The relative miR-21 expression was calculated based on the efficiency corrected ΔΔCt method and normalized with miR-20a and miR-200b. The y-axis is a log scale. A fold change >1 indicates upregulation in Bl compared to St samples [p≤0.03 (qPCR), p≤0.0001 (array); two-tailed t-test]. Inset, illustrates how non-isotopic Northern blot using digoxigenin-labeled LNAs against hsa-miR21 and hsa-U6 (control) are useful to detect the axolotl versions of these small RNAs. The axolotl miR-21 (Amex-miR-21) is detected as a band of ∼20 nt which is over expressed in blastema when compared with stump and blood samples.

