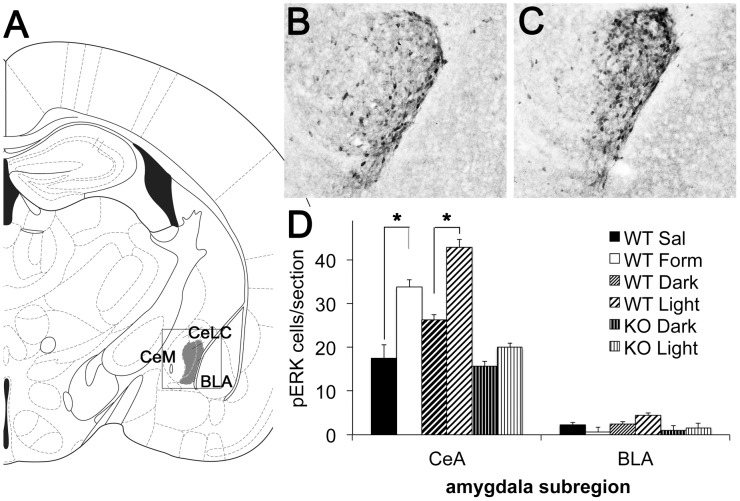
Figure 3. Light activates neurons in central amygdala.
(A) Line drawing indicating the region of interest within the basolateral (BLA), the medial (CeM) and lateral and capsular portions of the central (CeLC) amygdala. The boxed outline indicates the region of the amygdala represented in the micrographs to the right. (B) Example of pERK staining in a sham-treated P8 mouse pup that remained in the dark (WT Dark). (C) Example of pERK staining in P8 mouse pup exposed to light for 30 min (WT Light). (D) Quantification of the number of pERK-expressing neurons in CeLC and BLA areas. There were many fewer pERK-labeled cells within the CeM and BLA, and the BLA was counted as an out of region control. In WT pups, light produced a 1.6-fold increase in the number of pERK-expressing neurons (WT Dark pups n = 8 and WT Light pups n = 9). Supraorbital formalin injections produced a 2-fold increase in Fos staining compared to saline injections. (n = 4, both saline and formalin groups). Light did not induce pERK cells in KO mice (KO Dark n = 5, KO Light n = 9). Data are presented as means of the average number of pERK staining neurons in each animal ± SEM. Asterisks (*) indicate p<0.01.

