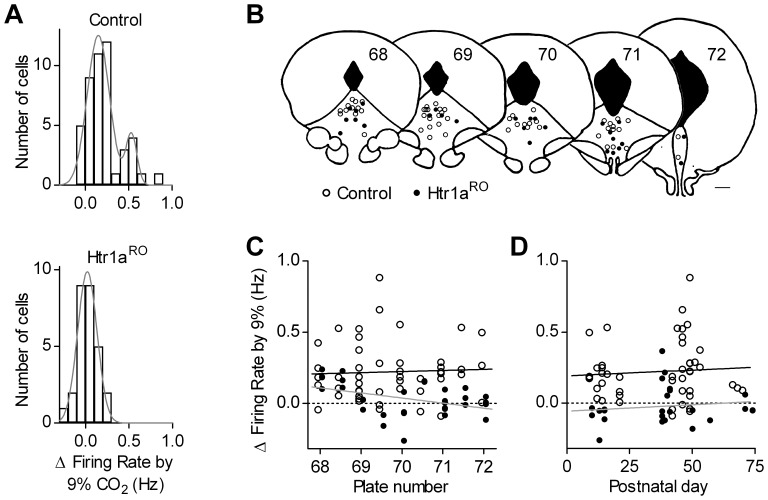
Figure 4. Distribution of pooled responses to hypercapnic challenge.
A, Bar graph showing the distribution of responses in control and Htr1aRO mice. Curves represent best fit of data to a double (Control, R2 = 0.901) and single Gaussian function (Htr1aRO, R2 = 0.952). B, Schematic diagram of frontal sections at various rostrocaudal levels of the DRN mouse raphe in which positions of the recorded serotonergic neurons in control (open circles) and Htr1aRO mice (filled circles) are reported. Numbers correspond to plates in [39]. C, Individual responses to 9% CO2 application in slices from control (open circles) and Htr1aRO mice (filled circles) plotted against the rostrocaudal position of the corresponding recorded neuron indicated by the plate number. Continuous and broken lines are best linear regressions of data in control and Htr1aRO, respectively. D, Individual responses to 9% CO2 application in slices from control (open circles) and Htr1aRO (filled circles) plotted against the postnatal age of the mouse at time of recording. Continuous and broken lines are best linear regressions of data in control and Htr1aRO, respectively.

