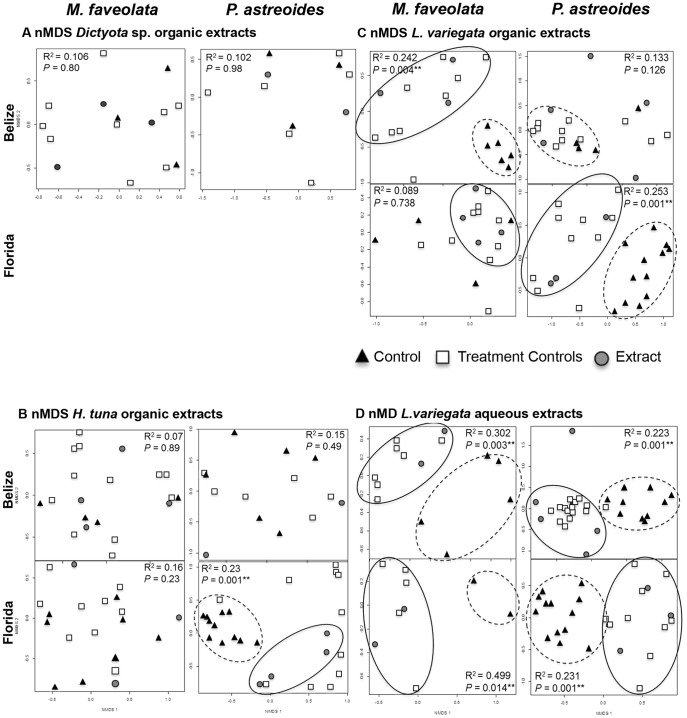
Figure 2. nMDS plots and PERMANOVA results.
nMDS plots based on binary DGGE profiles for each coral-extract interaction pair at each site (Belize & Florida) between M. faveolata or P.astreoides corals and extracts of: A. Dictyota sp. (organic), B. H. tuna (organic), C. L. variegata (organic), and D. L. variegata (aqueous). Solid circles enclose clusters related to extract-associated microbial samples and dashed circles enclose clusters related to initial coral control-associated microbial samples. PERMANOVA results are reported in the corner of each interaction pair, ** indicates a significance of P<0.05.

