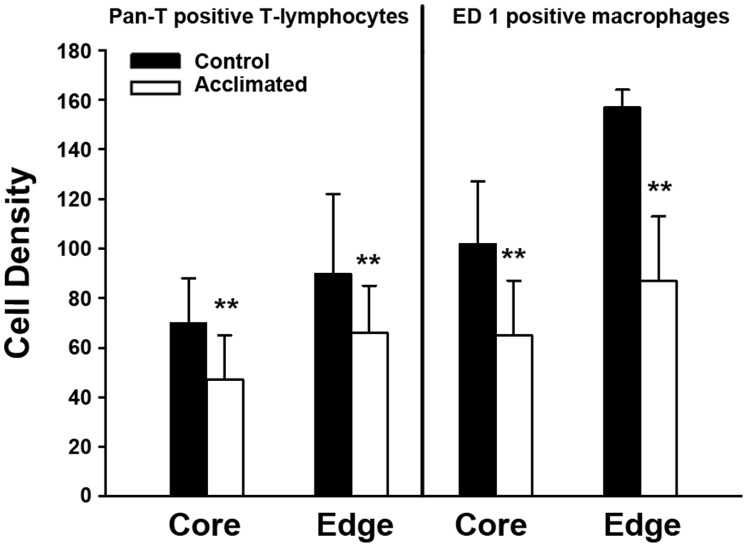
Figure 4. Density of Pan-T-cell lymphocytes and ED1 positive microglia/macrophages in the infarcted region of control (closed bars) and hypoxia acclimated (open bars) animals.
Regions were counted in a blinded fashion in the periphery (edge) of the infarcted region as well as in the center or core. The edge and core were arbitrarily chosen by the reader. Cell Density = number/field area (0.264 mm2). There was a significant reduction of T-cells (*p<0.05) and ED1-positive cells (**p<0.01) in the hypoxia acclimated group compared with controls (mean±S.D.).

