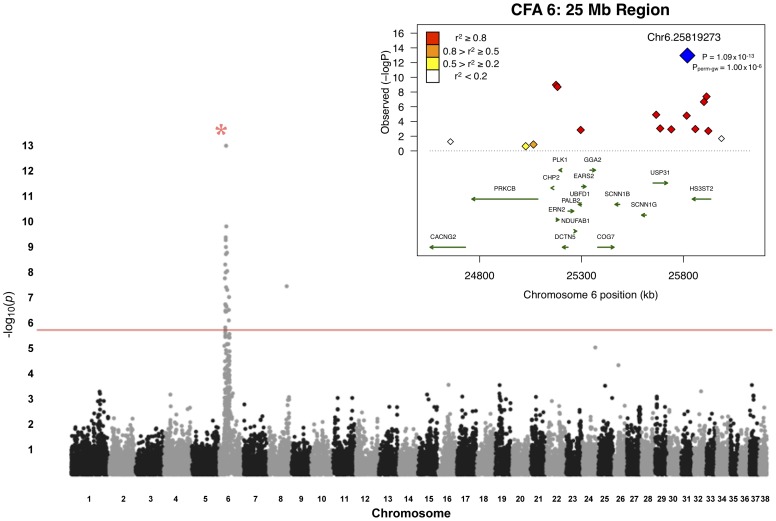
Figure 1. Manhattan plot of GWAS for adult-onset deafness.
Chromosome markers are plotted on the x-axis in order and alternately shaded. The -log10(p-value) is plotted on the y-axis. The red line indicates significance at the Bonferroni-corrected level for 30,000 SNPs. There is extensive regional support for an association on CFA6. The inset shows an enlargement of the 25-Mb association region, including genes of interest. The raw GWAS and permuted p-values (Pperm-gw) for the top SNP are also given.

