Figure 4.

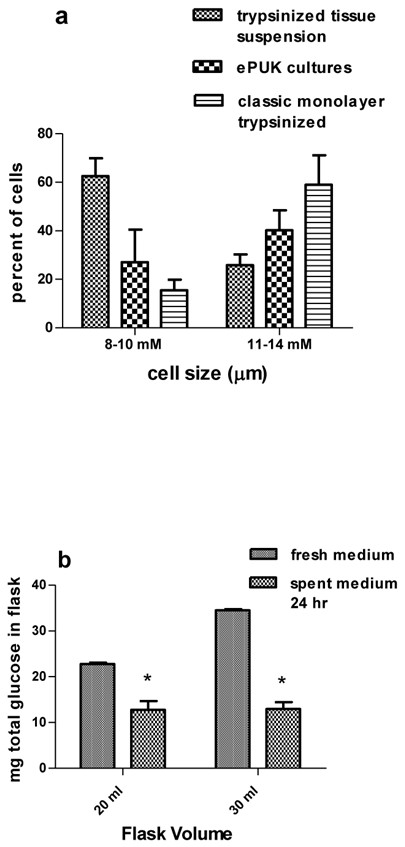
Size and glucose utilization by ePUK cells. 4a: ePUKs P1Sn and P1SNpn were studied. The cell suspensions produced from trypsinized tissue and size filtration of the resulting cell suspension consisted of 62.5% ±3.6 (SEM) small diameter cells (8–10 micron). The classically grown and passed P1,P2 cells contained 15.5% ± 2.2 small diameter cells while the ePUK cultures consisted of 27.1% ±4.3 micron cells. ePUK values n = 9, cell suspension n = 4 and classical monolayer n = 4 were compared using 2 way ANOVA and all means were significantly different at P ≤ 0.05. 4b: 20 ml of fresh medium contained 23 ± 0.3 mg glucose (approx. 114 mg/100 ml X 20 ml, n = 3) and 12.8 ±0.8 mg glucose after 24 hr. (n = 5). 30 ml of medium contained 34.4 ± 0.4 mg glucose (approx. 114 mg/100 ml X30 ml, n = 3) and 13.0 ± 0.7 mg of glucose after 24 hr. (n = 6), *P < 0.05 2 way ANOVA.
