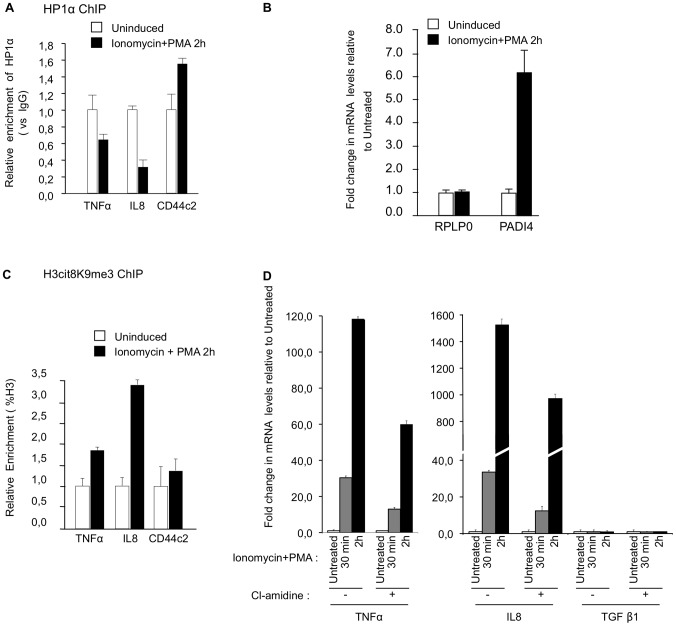
Figure 5. PADI activity facilitates activation of TNFα and IL8 transcription in T cells.
(A) ChIP with anti-HP1α antibodies was carried out with chromatin from Jurkat cells either untreated or treated with PMA and ionophore (ionomycin). The relative enrichments of HP1α on the indicated promoters were measured by qPCR. Data are presented relative to non-immune IgG. Changes in enrichment are presented relative to the un-induced control (set to 1). Values are means ± SEM from two PCR measures of two independent ChIP experiments. (B) Total RNA was isolated from Jurkat cells either un-stimulated or treated with ionomycin and PMA for 2 hour. Changes in mRNA levels for the indicated genes were quantified by RT-qPCR. The data are presented as the means ± SEM of triplicate experiments. (C) ChIP with anti-H3cit8K9me3 antibodies was carried out as in A. Data are presented as a percentage of histone H3. Changes in enrichment are presented relative to the un-induced control (set to 1). Values are means ± SEM from two PCR measures of two independent ChIP experiments. (D) Total RNA was isolated from Jurkat cells treated as in B minus or plus PADI-inhibitor cl-amidine as indicated. Changes in mRNA levels for the indicated genes were quantified by RT-qPCR. The data are presented as the means ± SEM of duplicate experiments.

