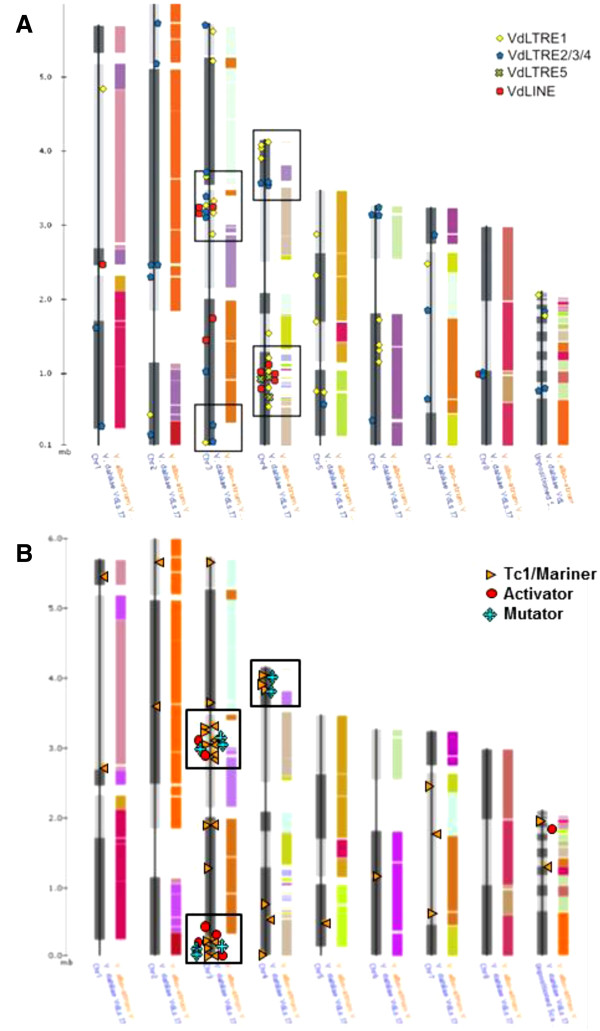
Figure 3 .
Distribution of Class I and II TEs within the VdLs.17 genome. The ChromoMap genome browser available online at the BROAD Institute website was used to visualize the TE sequences against a synteny map of the VdLs.17 and VaMs.102 sequenced genomes. The biased chromosome localization of the retroelements ( A) and the DNA elements ( B) in the “lineage-specific” regions of Vd.Ls17 are outlined in black.

