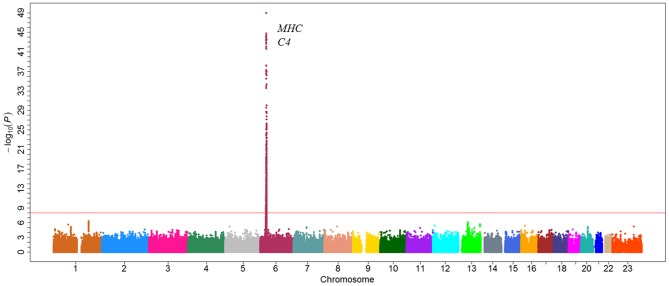
Figure 2. Manhattan plot of genome-wide association analyses for C4 level.
X-axis shows chromosomal positions. Y-axis shows −log10 Pvalues from linear regression adjusted for age and logBMI. C4 level are log-transformed and fit for a normal distribution. The horizontal solid line indicates the preset threshold of P=5×10⁻⁸.

