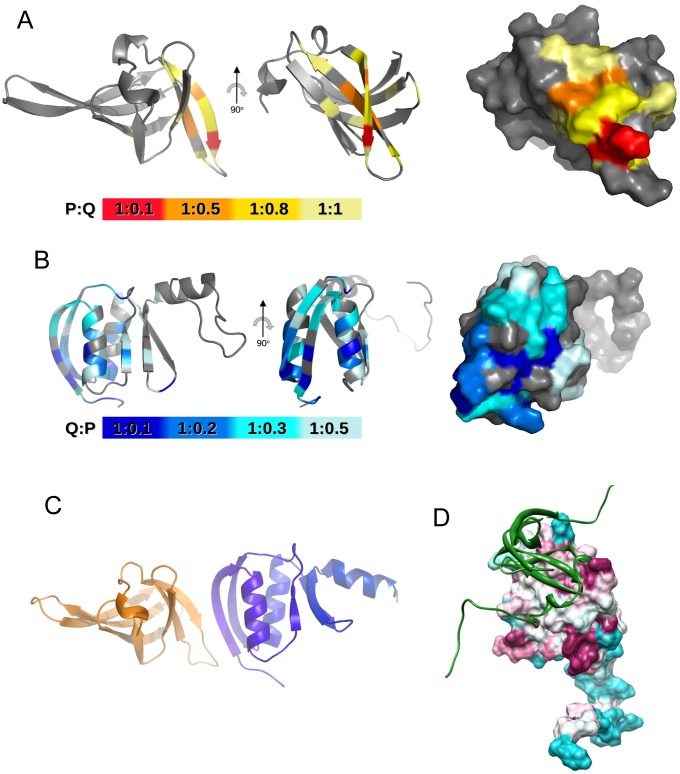
Figure 4. Structural model for the PilP C-domain bound to the PilQ N0 domain.
A) Peak attenuation mapped on to the PilP C-domain (PDB accession 2IVW) following titration with N0N1PilQ343–545. Ratios of PilP:PilQ were colored as follows: 1∶0.1, red; 1∶0.5, orange; 1∶0.8, yellow; 1∶1, pale-yellow. Left, ribbon plot with β1 stand marked; right, surface plot. B) Peak attenuation mapped on to N0PilQ343–442. Ratios of PilQ:PilP were colored as follows: 1∶0.1, dark-blue; 1∶0.2, blue; 1∶0.3, cyan; 1∶0.5, pale-blue. C) Model of the PilP77–164: N0PilQ343–442 complex generated from CNS1.2 [56], with PilP77–164 in gold and N0PilQ343–442 in blue. Flexible residues at the N- and C-termini have been removed for clarity. D) Surface plot of the N0PilQ343–442 domain generated using CONSURF [35] and CHIMERA [69], with the same color scheme as used in Figure 2B. A ribbon plot of the PilP C-domain structure [29] is shown in green. The same sequence set was used for CONSURF as employed in Figure 2 B).

